


Is This a Dip Buying Opportunity or the Start of a Correction?
On Tuesday, Lululemon Athletica (LULU) is anticipated to release second quarter EPS of $0.52 vs $0.96 last year on sales of $830.1 million compared to $883.4 million a year ago. The Co designs athletic accessories and apparel, and its expected move based on front-month options is 9.9%. The last time the Co reported earnings the stock fell 3.8%. Looking at a daily chart, the RSI is above its neutrality area at 50. The MACD is positive and below its signal line. The stock could retrace in the short term. Moreover, the stock is trading under its 20 day MA ($366.33) but above its 50 day MA ($337.61). We are looking at the final target of $414.00 with a stop-loss set at $331.00.
On Wednesday, HD Supply (HDS) is expected to announce second quarter EPS of $0.74 compared to $1.08 a year ago on revenue of $1.6 billion, in line with last year. The Co is one of the largest home improvement product distributors in North America and on August 11th, Clayton, Dubilier & Rice, a private-equity firm, announced an agreement with the Co to acquire its construction and industrial business known as White Cap for 2.9 billion dollars in cash. From a technical point of view, the RSI is below 50. The MACD is positive and below its signal line. The MACD must penetrate its zero line to expect further downside. Moreover, the stock is trading under its 20 day MA ($40.69) but above its 50 day MA ($37.27). We are looking at the final target of $34.90 with a stop-loss set at $42.10.
On Thursday, Peloton Interactive (PTON) is likely to unveil fourth quarter EPS of $0.11 vs an LPS of $1.88 last year on revenue of $573.0 million compared to $223.3 million a year ago. The Co operates an interactive fitness platform and on September 1st, the Co announced the formation of the Peloton Health and Wellness advisory Council, which will look at how it can positively impact the physical, emotional and mental well-being of its members. On another note, the Co's current analyst consensus rating is 23 buys, 2 holds and 1 sell, according to Bloomberg. From a chartist's point of view, the RSI is above its neutrality area of 50. The MACD is positive and above its signal line. The stock is trading above its 20 day MA ($71.31) and 50 day MA ($66.78). We are looking at the final target of $112.85 with a stop-loss set at $65.29.
On Friday, Kroger (KR) is awaited to post second quarter EPS of $0.50 compared to $0.44 a year ago on sales of $29.6 billion vs $28.2 billion last year. The Co operates a chain of superstores and corner stores, and on August 25th, Impossible Foods' launched its Impossible Burger patties at approximately 2,000 grocery stores nationwide owned by the Co. In other news, on August 14th, Warren Buffett's Berkshire Hathaway revealed that it increased its stake in the Co by 16% to 21.9 million shares during the second quarter of 2020, according to a 13F filing with the US Securities and Exchange Commission (SEC). Technically speaking, the RSI is below 50. The MACD is positive and below its signal line. The MACD must penetrate its zero line to expect further downside. Moreover, the stock is trading under its 20 day MA ($35.64) but above its 50 day MA ($34.68). We are looking at the final target of $32.80 with a stop-loss set at $37.20.
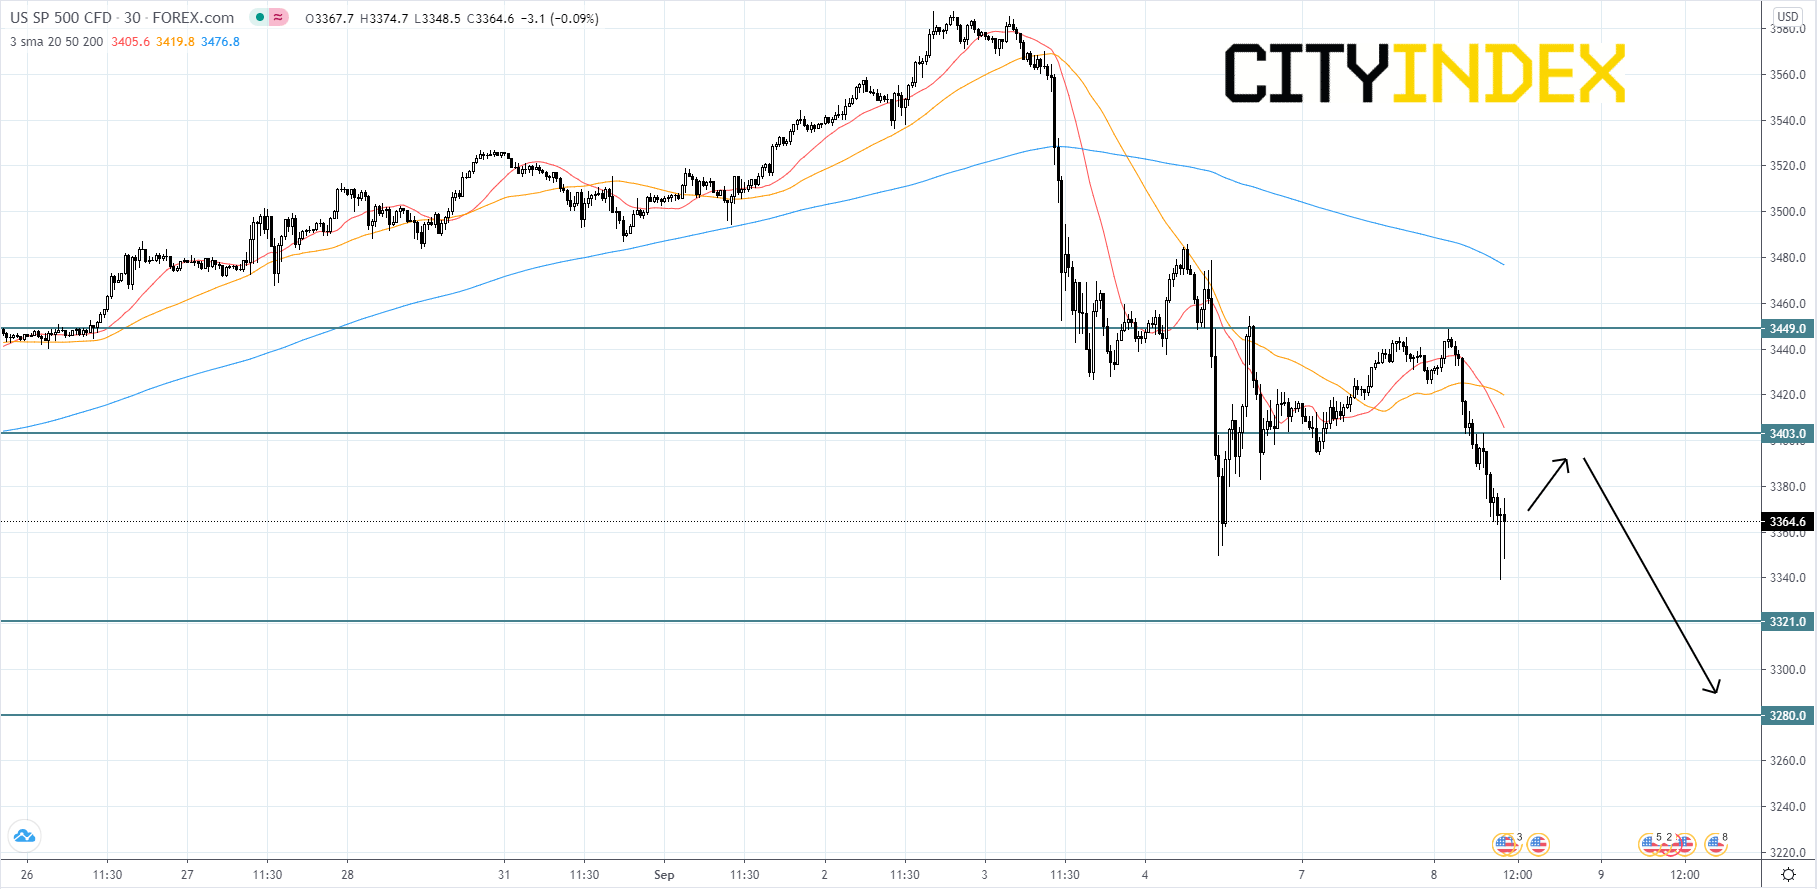
Looking at the S&P 500 CFD on a 30 minute chart, the index turned down on September 3rd after price broke below its 200-period simple moving average (SMA) and was unable to find footing. The S&P has begun a short-term downtrend after reaching a record high of 3587.70 on September 2nd. The powerful declines and short rallies should have investors on the edge of their seats. Is this a dip buying opportunity or the beginning of a correction? The tech sector is also feeling some of the pain as shares of Tesla and Apple were the worst hit of the big names last week. Other tech stocks have also been experiencing a dip in prices. The index will likely continue to have rallies as traders play the intraday movements. However as long as price remains below its 200-period SMA, the bias is bearish. Price will probably rally back up to 3403.00, where it will meet resistance and likely be sent down to 3321.00. If price breaks below 3321.00, it could fall further to 3280.00. If price gets above 3403.00, traders should look to 3449.00 as a strong resistance level.
Source: GAIN Capital, TradingView
On Wednesday, HD Supply (HDS) is expected to announce second quarter EPS of $0.74 compared to $1.08 a year ago on revenue of $1.6 billion, in line with last year. The Co is one of the largest home improvement product distributors in North America and on August 11th, Clayton, Dubilier & Rice, a private-equity firm, announced an agreement with the Co to acquire its construction and industrial business known as White Cap for 2.9 billion dollars in cash. From a technical point of view, the RSI is below 50. The MACD is positive and below its signal line. The MACD must penetrate its zero line to expect further downside. Moreover, the stock is trading under its 20 day MA ($40.69) but above its 50 day MA ($37.27). We are looking at the final target of $34.90 with a stop-loss set at $42.10.
On Thursday, Peloton Interactive (PTON) is likely to unveil fourth quarter EPS of $0.11 vs an LPS of $1.88 last year on revenue of $573.0 million compared to $223.3 million a year ago. The Co operates an interactive fitness platform and on September 1st, the Co announced the formation of the Peloton Health and Wellness advisory Council, which will look at how it can positively impact the physical, emotional and mental well-being of its members. On another note, the Co's current analyst consensus rating is 23 buys, 2 holds and 1 sell, according to Bloomberg. From a chartist's point of view, the RSI is above its neutrality area of 50. The MACD is positive and above its signal line. The stock is trading above its 20 day MA ($71.31) and 50 day MA ($66.78). We are looking at the final target of $112.85 with a stop-loss set at $65.29.
On Friday, Kroger (KR) is awaited to post second quarter EPS of $0.50 compared to $0.44 a year ago on sales of $29.6 billion vs $28.2 billion last year. The Co operates a chain of superstores and corner stores, and on August 25th, Impossible Foods' launched its Impossible Burger patties at approximately 2,000 grocery stores nationwide owned by the Co. In other news, on August 14th, Warren Buffett's Berkshire Hathaway revealed that it increased its stake in the Co by 16% to 21.9 million shares during the second quarter of 2020, according to a 13F filing with the US Securities and Exchange Commission (SEC). Technically speaking, the RSI is below 50. The MACD is positive and below its signal line. The MACD must penetrate its zero line to expect further downside. Moreover, the stock is trading under its 20 day MA ($35.64) but above its 50 day MA ($34.68). We are looking at the final target of $32.80 with a stop-loss set at $37.20.
Looking at the S&P 500 CFD on a 30 minute chart, the index turned down on September 3rd after price broke below its 200-period simple moving average (SMA) and was unable to find footing. The S&P has begun a short-term downtrend after reaching a record high of 3587.70 on September 2nd. The powerful declines and short rallies should have investors on the edge of their seats. Is this a dip buying opportunity or the beginning of a correction? The tech sector is also feeling some of the pain as shares of Tesla and Apple were the worst hit of the big names last week. Other tech stocks have also been experiencing a dip in prices. The index will likely continue to have rallies as traders play the intraday movements. However as long as price remains below its 200-period SMA, the bias is bearish. Price will probably rally back up to 3403.00, where it will meet resistance and likely be sent down to 3321.00. If price breaks below 3321.00, it could fall further to 3280.00. If price gets above 3403.00, traders should look to 3449.00 as a strong resistance level.
Source: GAIN Capital, TradingView
Latest market news
Yesterday 11:09 PM
Yesterday 11:01 PM
Yesterday 04:00 PM
Yesterday 01:15 PM
Yesterday 11:30 AM
Yesterday 08:18 AM
Latest Equities articles
April 12, 2024 02:28 AM
April 7, 2024 08:46 PM
March 31, 2024 11:22 AM
