


June 30, 2021 11:16 AM
Is the US housing market a bit frothy?
Buying and selling your house may soon get a little tougher. Last week, Existing Homes Sales for May were released. The print was 5.8 million, the lowest reading in 11 months, and it’s approaching pre-pandemic levels. New Homes Sales for May were also released last week. The print was 769,000 (annualized), the lowest reading in over 1 year. Pending home sales for May released Wednesday showed a 13.1% YoY increase vs +25% expected. This was the lowest reading since July 2020. (However, we should note that the MoM print was +8% vs -2% expected. With lower sales, and higher pending sales, one could speculate that next months pending home sales will be lower.)
The S&P CoreLogic Case-Schiller 20-city home price index was released on Tuesday. The index rose 14.9% in April, and the March print was revised higher to 13.4%. This was the largest annual increase in 21 years!
Although housing sales are nearing pre-pandemic levels, price levels are much higher due to low interest rates. However, some homebuyers, especially first-time house buyers, are being priced out of the market. As we can see from the data, housing sales have already begun to slow. At some point prices will have to be lowered, as demand won’t be there. This is especially true at lower price points. This seems to be representative of many countries around the world, and central banks have noticed. Some have explicitly mentioned they are concerned about the housing prices. In statements by US Fed officials, some have mentioned that one of the first things the Fed can do once they begin tapering is to reduce the amount of MBS purchases. The Fed is currently buying $40 billion per month in MBS (as part of the $120 billion per month in total bond purchases).
Everything you need to know about the Federal Reserve
We’ve been paying a lot of attention to the DXY lately, especially since the last FOMC meeting on June 16th. On a 240-minute timeframe, price broke higher from a descending wedge in early June. However, it wasn’t until the FOMC meeting on June 16th that the index began to move aggressively. Due to the hawkish-tilt from the FOMC, the US Dollar Index began moving higher in earnest to the 61.8% Fibonacci retracement level from the March 31st highs to the May 25th lows, near 92.00. The index pulled back in a pennant formation. Notice how the RSI was in overbought territory near 85 before price pulled back. On June 25, DXY moved out of the pennant and began moving towards its target. The target for a pennant is the length of the pennant pole added to the breakout point of the pennant, which points to 93.37, just pips shy of the target for the retracement of the wedge, which is 93.44.
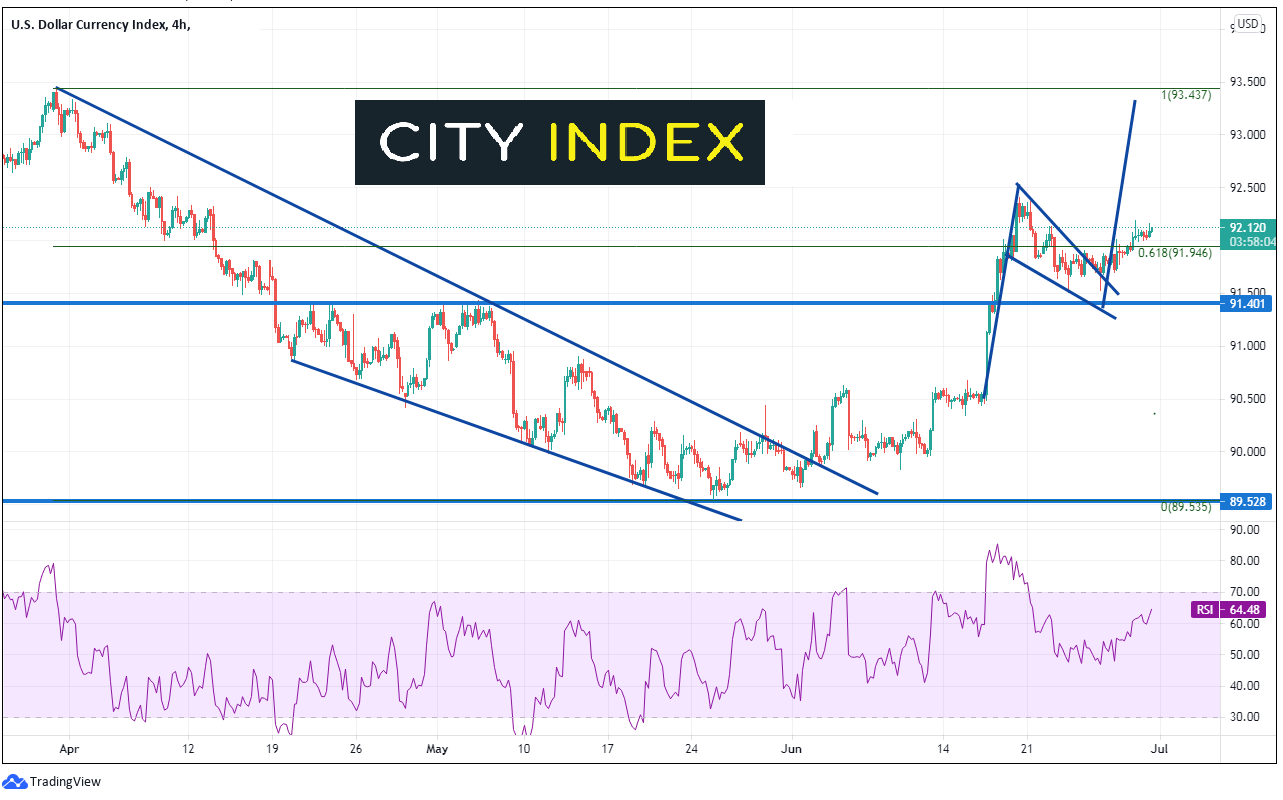
Source: Tradingview, City Index
If traders wish to trade the DXY but don’t have access to it, 2 alternatives are USD/CHF and USD/SEK, which have high positive correlations to the DXY. Below are 2 recent articles which show these correlations:
DXY isn’t a currency pair, but USD/CHF is!
Sweden’s in trouble, and it has nothing to do with Euro 2020
Home sales seem to be slowing while prices are rising. At some point (probably sooner than later), prices will need to decline to induce more demand. Once the Fed begins tapering, MBS purchases may be the first to go, which would raise rates in the mortgage arena, and therefore, cause prices to come down.
Learn more about forex trading opportunities.
Latest market news
Yesterday 03:30 PM
Yesterday 01:23 PM
Yesterday 11:00 AM
Yesterday 08:15 AM
Latest Forex articles

Yesterday 11:00 AM
April 23, 2024 11:09 PM
April 23, 2024 04:00 PM