


June 17, 2021 6:29 PM
“Introduction to Technical Analysis” webinar series in Practice!
There are many facets to technical analysis and many different tools traders can use when observing price action on a chart. However, there are 3 main tenants of technical analysis that traders should always remember:
- Market action discounts everything
- Price moves in trends
- History repeats itself
There are several different types of charts that traders can use, including line charts, bar charts, and candlestick charts, which have unique patterns in addition to traditional continuation and reversal patterns.
In the EUR/USD chart below, on May 26th, the candlestick on the daily timeframe was a bearish engulfing pattern. This was the first signal that a reversal was possible. Price began to trend lower, and on June 1st, price formed a shooting star. By connecting the tops from May 26th and June 1st, a downward sloping trendline was drawn (red). However, the selloff was not aggressive (remember, the trend is your friend!) and on June 3rd, a trendline was formed across the bottoms to form a channel. On June 9th, another shooting star was formed as price touched resistance at the downward sloping trendline of the channel (red). Resistance occurs when prices stop rising and may begin to fall. It is viewed as a ceiling and a decision area. (The opposite of resistance is support.) Price finally broke through the bottom of the channel and several levels of support, including the 200 Day Moving Average, on June 16th and 17th.
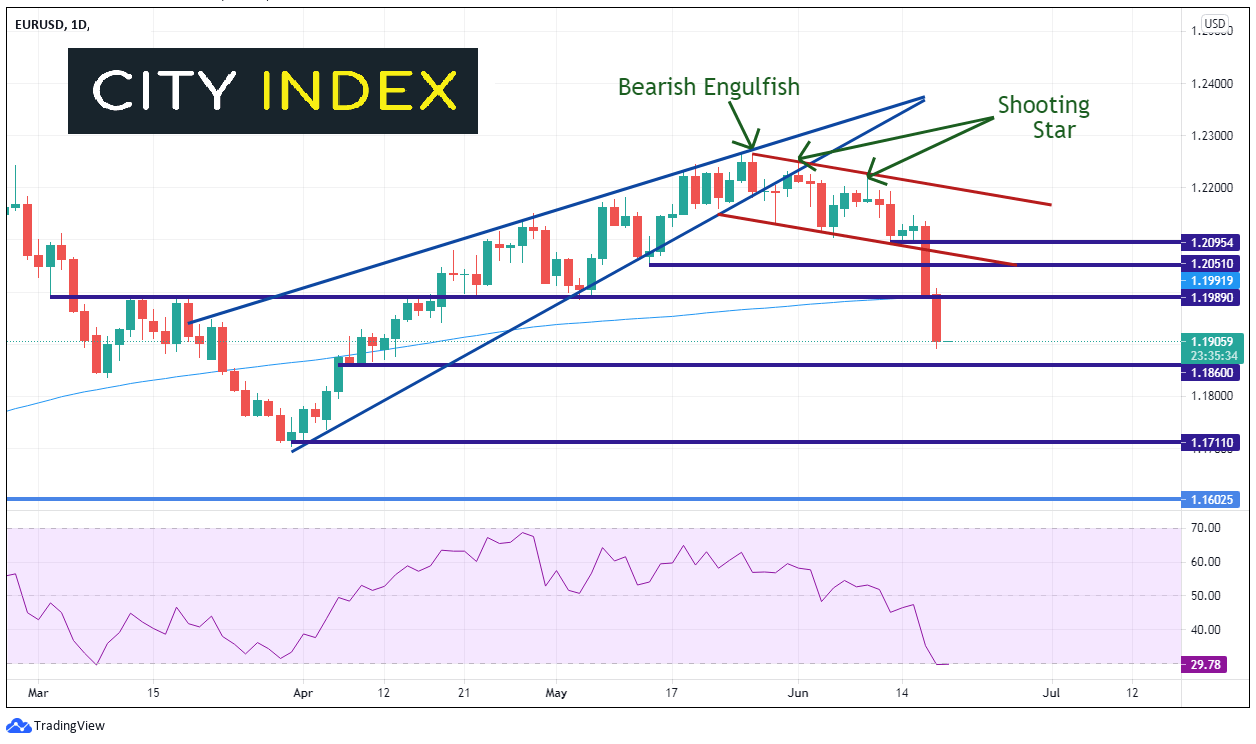
Source: Tradingview, City Index
Looking back after the bearish engulfing candlestick on May 26th, EUR/USD also broke through the bottom trendline of a rising wedge, which is a reversal pattern. The target upon the break of a rising wedge is a 100% retracement of the wedge, which in this case is near 1.1704.
Notice that as of the time of this writing, the RSI is below 30, which is considered oversold. Therefore, EUR/USD may be ready for a short-term bounce and the RSI moves back into neutral territory. If price does bounce, the first resistance level is the confluence of the 200 Day Moving Average and horizontal resistance near 1.1990. Above there is the confluence of the bottom trendline of the previous channel (red) and horizontal resistance near 1.2050. First horizontal support is at 1.1860 and then the lows from March 31st (and the wedge target) at 1.1711.
Remember that price rarely moves in a straight line. Watch for short-term bounces along the way if price is to move to target. New patterns, such as flags or pennants may form along the way, which may help give an idea of future direction and price targets.
Many of the terms and tools taught in the Introduction to Technical Analysis webinar series are included in this analysis of EUR/USD on the daily timeframe. The more tools you have in your toolbox, the better your analysis will be!
Learn more about forex trading opportunities.
Ready to put these lessons into practice?
Consider opening a live or demo account today!
How to trade with City Index
Follow these easy steps to start trading with City Index today:
- Open a City Index account, or log-in if you’re already a customer.
- Search for the market you want to trade in our award-winning platform.
- Choose your position and size, and your stop and limit levels.
- Place the trade.
Latest market news
Yesterday 01:23 PM
Yesterday 06:01 AM
April 18, 2024 11:27 PM
Latest Forex articles
Yesterday 06:01 AM
April 17, 2024 02:40 PM
April 17, 2024 04:47 AM