Indices Technical Analysis Wall Street UK 100 Germany 30
Wall Street Globally, most of the major equity indices experienced a steep decline that began shortly after mid-September and then found a tentative bottom […]
Wall Street Globally, most of the major equity indices experienced a steep decline that began shortly after mid-September and then found a tentative bottom […]
Globally, most of the major equity indices experienced a steep decline that began shortly after mid-September and then found a tentative bottom and start of a rebound in mid-October.
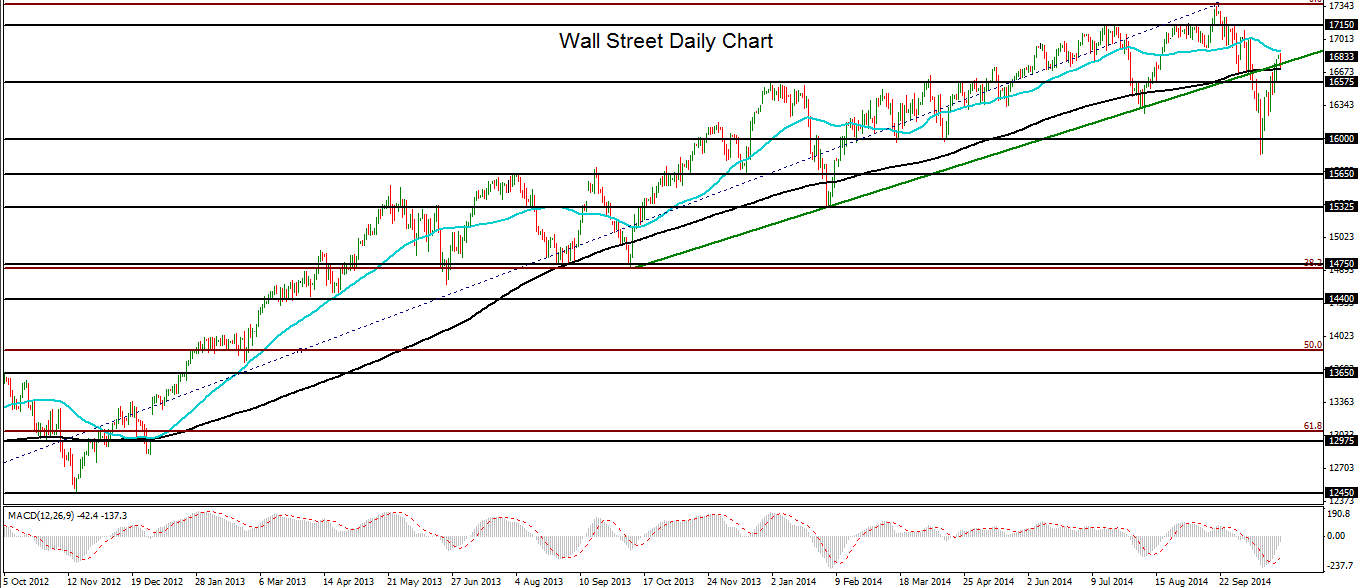
During the month-long decline, the Wall Street index (which tracks the Dow Jones Industrial Average) fell on 19th October from its newly-established all-time high around 17,350 down to an eight-month low around 15,850 on 15 October. This represented a drop of more than 8% in less than four weeks.
Although this decline has so far fallen short of fulfilling the 10% or more correction that many analysts were expecting, it was the largest percentage pullback since late 2012.
By early October, the index had plunged below both the 50-day and 200-day moving averages, a key one-year uptrend line extending back to October 2013, and several major support levels. These levels include 16,575 and the 16,260 previous low recorded in early August.
After hitting the noted eight-month low around 15,850 on 15th October, the Wall Street index turned around abruptly and rebounded, quickly recovering over half of its previous losses. In the process, the index again rose above its pivotal 200-day moving average.
Despite the substantial decline, the index has thus far failed to make a full correction and has shown resilience in its strong rebound. The pullback that occurred served as a much-needed respite to the previously over-extended equities market.
Currently, the long-term bullish trend continues to remain intact. As long as the index continues to trade above major support around the 16,000 level, further highs might be expected.
To the upside, key price targets reside around the 17,150 level followed by the noted all-time high around 17,350.
On a longer-term basis, the 18,000 psychological level serves as a major price objective in record territory if uptrend momentum continues further.
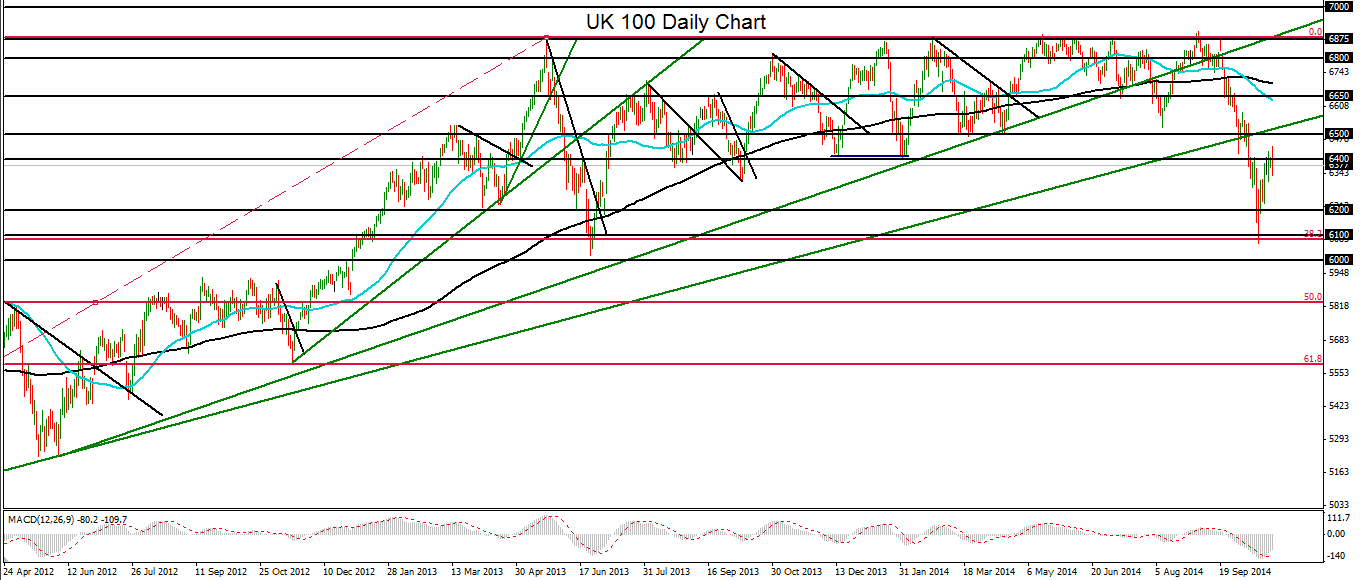
The UK 100 index, which reflects the FTSE 100 index in the UK, suffered a particularly damaging plunge beginning in early September from major resistance around 6900.
From almost a 15-year high of 6905 on 4th September to a 15-month low of 6070 on 16th October, the index fell by 835 points in the span of six weeks. This represented a full 12% correction, significantly more than the declines during the same period that were experienced by its US counterparts.
In the process of that correction, the UK 100 plunged below both its 50-day and 200-day moving averages, as well as several very significant support levels. These levels include 6500, 6400, and 6200.
In early October, the 50-day moving average crossed below the 200-day moving average for the first time since mid-2012, a significant bearish indication.
The plummet finally subsided in mid-October at the noted 15-month low of 6070, which was also around the 38% Fibonacci retracement of the long-term bullish trend from 2011.
After hitting that low, the index rebounded sharply and recovered a portion of its losses. So far, however, the UK 100’s rebound has recovered significantly less than half the lost ground.
Although the index continues to trade within a long-term uptrend, this correction has significantly damaged the bullish momentum that prevailed when the UK 100 was trading just below major resistance around the 6900 level.
The 6500 resistance level remains the key upside level to watch for any indication of a continued recovery. A break back above 6500 could place the index on track once again to reach towards higher resistance levels around 6650 and the noted 6900 level.
To the downside, further weakness and a significant warning of a continued correction would be indicated on a re-break below the 6100 support area.
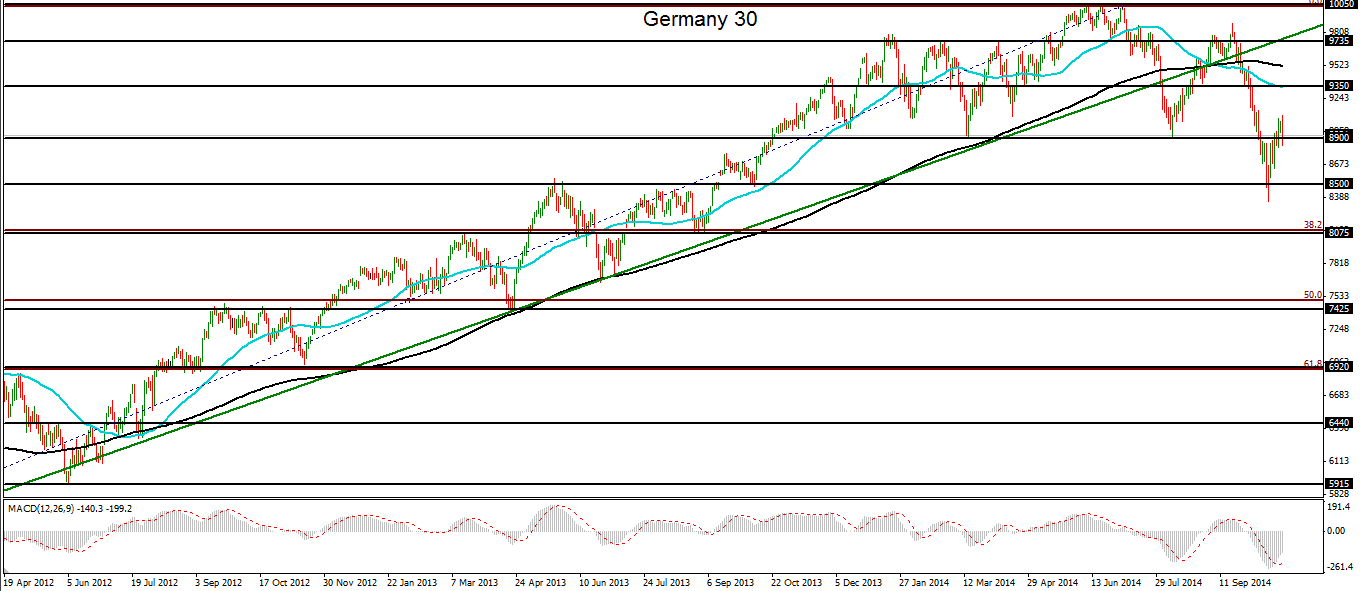
The Germany 30 index, which tracks the DAX, plummeted by a staggering 15% in less than four weeks. This very substantial correction brought the index down from a 9892 high on 19 September to a 13-month low of 8351 on 16 October.
This plunge followed a similar decline in the month of July when the index fell sharply from its all-time high just above 10,030.
The most recent correction that began in late September prompted the Germany 30 to drop below both its 50-day and 200-day moving averages, as well as a key long-term uptrend line extending all the way back to late 2011.
Major support levels were also broken to the downside, including the 9350 and 8900 price areas. The drop also spiked briefly below the key 8500 support level before rebounding.
For the first time since 2012, the 50-day moving average crossed below the 200-day moving average in September, a significant bearish indication.
In mid-October, the index rebounded from its noted 13-month low of 8351. The recovery to date, however, has not been nearly as robust as its fall. Continuing to be plagued by economic troubles, the Germany 30 remains pressured to the downside.
Any major re-break below the key 8500 support level could prompt the index to correct even further, with a significant downside support target around 8075.
