


November 23, 2021 6:01 PM
A funny thing happened on the same day Federal Reserve Chairman Jerome Powell was re-appointed by US President Joe Biden. The tech-heavy NASDAQ 100 (and the S&P 500) put in a new all-time high, then it didn’t. Supply-chain issues leading to slow Christmas sales, fears of covid return, inflation, “buy the rumor, sell the fact” on Powell’s re-appointment were all possible reasons that the NASDAQ 100 sold off on Monday.
Trade NASDAQ 100 now: Login or Open a new account!
• Open an account in the UK
• Open an account in Australia
• Open an account in Singapore
Those are all valid reasons from a fundamental outlook as to why the index reversed during mid-day on Monday. However, if we delve the charts on a daily timeframe, it appears as though this selloff has been in the making since at least mid-October:
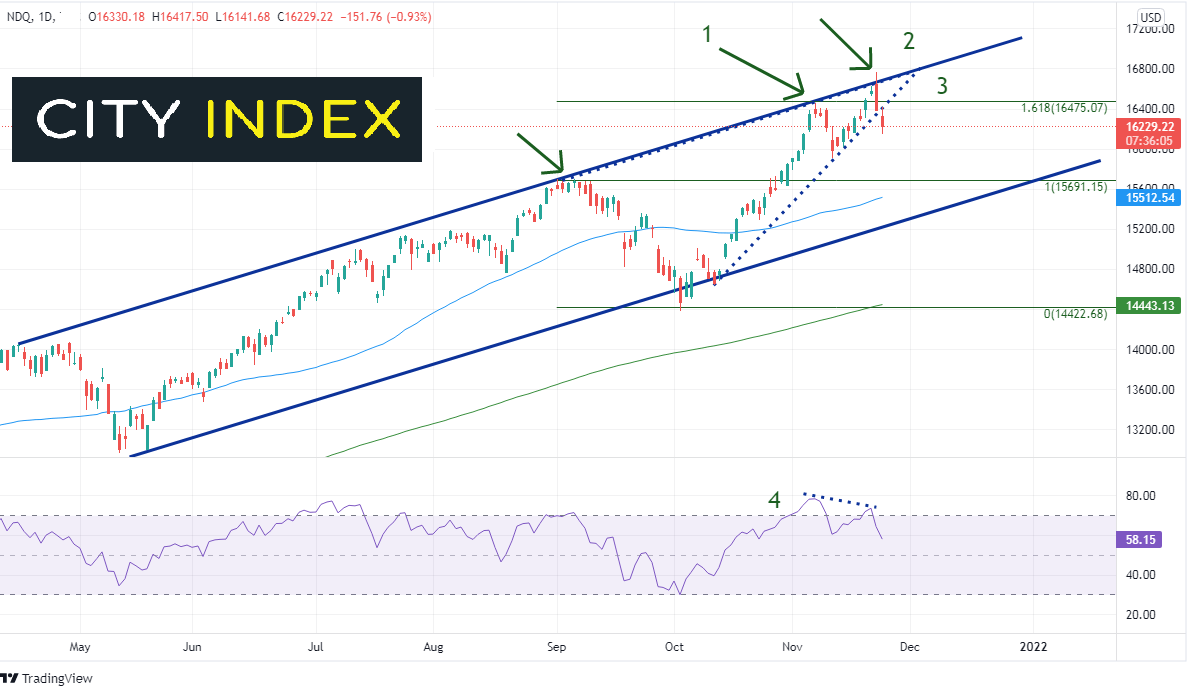
Source: Tradingview, Stone X
- NDX has been moving higher in an orderly channel since mid-May and made a false breakout through the top of the channel.Notice that in early September and on November 5th price touched the top trendline of the channel, and pulled back
- Price had been forming an ascending wedge since mid-October when the NDX tested and failed to break through the bottom trendline of the channel.On Monday, price posted a false breakout above the top line of the ascending wedge near the apex, and pulled back into the wedge, closing at the bottom trendline (The target for the breakdown from an ascending wedge is a 100% retracement of the wedge)
- NDX reached the target of the 161.8% golden Fib level on Friday from the highs on September 2nd to the lows on October 4th.
- The RSI was in overbought territory above 70 and was diverging from price.
Also, the candlestick on the daily timeframe is a bearish engulfing candle, which is bearish for price.
Everything you want to know about the NASDAQ 100
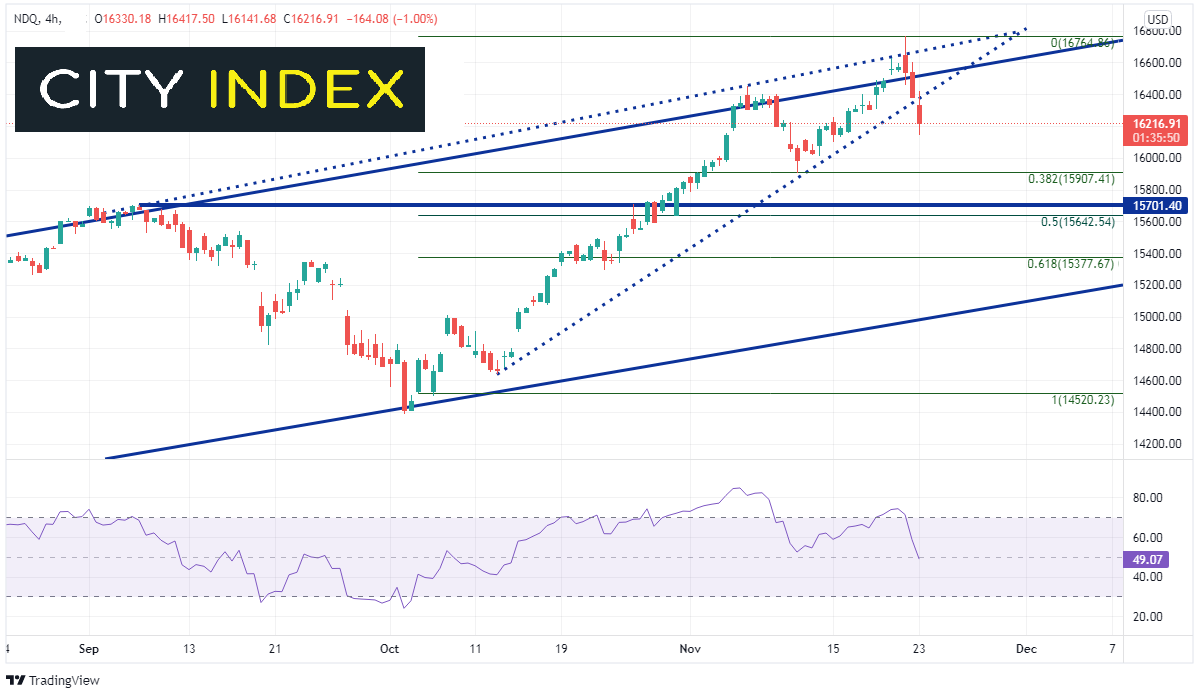
I know what you are thinking, “Monday Morning Quarterback”! Anyone can do this analysis after the price move occurred! On a 240-minute chart, where can price move from current levels (near 16257)? For starters, first resistance is at Tuesday’s highs, which also happens to be the bottom trendline of the ascending wedge, near 16,417. A close second resistance is at the top trendline of the upward sloping channel at 16460, and finally Monday’s highs at 16765. With all the resistance above, price should have a tough time making new highs any time soon. First support is at the 38.2% Fibonacci retracement from the September 8th highs to the October 4th lows at 15907.5. Below there is a confluence of horizontal support and the 50% retracement of the same time period between 15643 and 15700. The 200 Day Moving Average comes in just below at 15512.54 (see daily).
Source: Tradingview, Stone X
The NASDAQ 100 has broken down in significant fashion over the last 2 days after a bit of negative news and a confluence of resistance on the charts. Is the index ready to reverse and go bid? Maybe not just yet given the technicals. However, what could be the next catalyst to cause the index to move aggressively one way or another? Perhaps the US PCE data to be released on Wednesday, the light holiday volume on Thursday, or the Black Friday sales data released this weekend. Watch to see how many items will be “out of stock” due to supply chain issues over the weekend!
Learn more about forex trading opportunities.
Latest market news
Latest Indices articles

April 17, 2024 11:00 AM
April 16, 2024 08:00 PM
April 16, 2024 04:54 PM