February 13, 2022 7:53 PM

Last week, France’s President Macron said he received assurances from Putin that forces conducting military exercises in Belarus would return to their bases and that the buildup of forces on the Ukraine border would cease. However, Putin later denied these comments. On Friday, US Secretary of State Anthony Blinken said that Russia was still amassing troops near the border and an invasion was imminent, possibly before the end of the Olympics. He told all US citizens to leave Ukraine immediately. On Sunday, it was reported that Putin has communicated plans to move into Ukraine on Wednesday. If these reports are to be believed, safe haven assets should be the beneficiaries leading up to an invasion. These include such instruments as the Japanese Yen, the Swiss Franc, Bonds and Gold. In addition, oil should also remain bid as fears of lack of supply from Russia.
Safe Havens: What are they and why do they matter?
Markets got a taste of this price action last week as the comments from the White House were released. EUR/JPY moved from above 132.00 down to the 200 Day Moving Average at 130.39. If the continued threat of invasion persists, the 61.8% Fibonacci retracement level from lows of January 27th to the highs of February 10th crosses below at 130.12. Support below there is at the 50 Day Moving Average at 129.79, a confluence of support between 129.34 and 129.53, and then the lows from January 25th at 128.20.
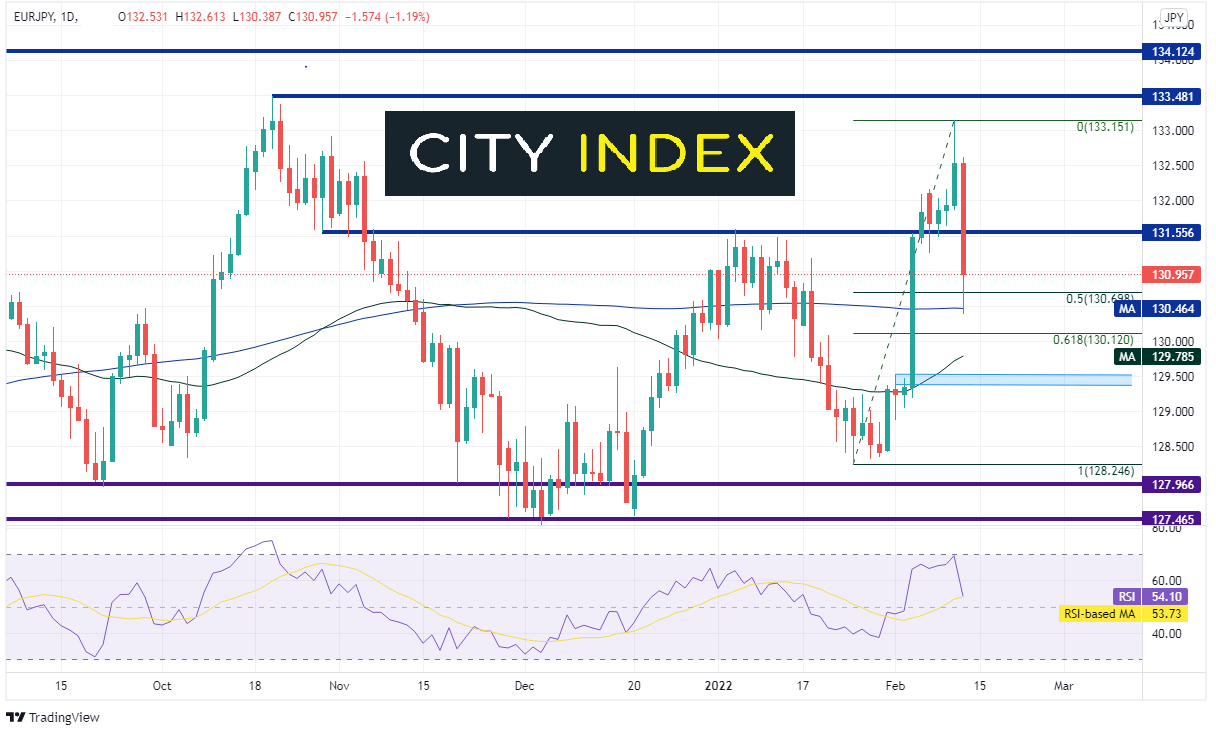
Source: Tradingview, Stone X
Gold also benefited from the news release. XAU/USD moved from 1827.4 to 1865.5, piercing through the top, downward sloping trendline of a long-term symmetrical triangle. First resistance is at the November 21st, 2021 highs at 1875.8. Above there is a confluence of resistance at the 127.2% Fibonacci extension from the highs of November 21st, 2021 to the low of December 15th, 2021, horizontal resistance, and the 61.8% Fibonacci extension from the August 2020 highs to the lows in March 2021 between 1909.7 and 1923. If price breaks through that range, the 161.8% Fibonacci extension of the shorter timeframe is at 1952.9.
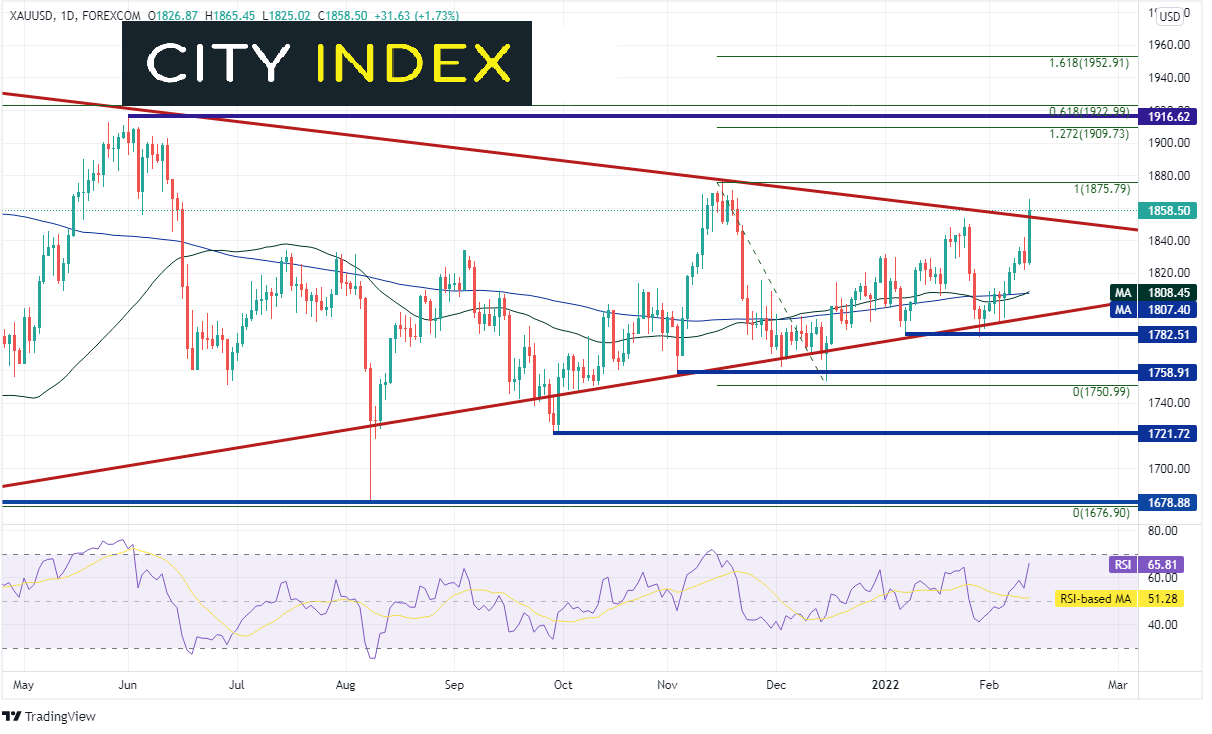
Source: Tradingview, Stone X
As mentioned, WTI Crude oil also moved higher on the release of the Russian headlines on Friday, from 91.12 to 94.63. In doing so, price pierced through a long-term upward sloping trendline near 94.00. If the headlines continue to be negative, there is a confluence of horizontal resistance from 2014 and the 161.8% Fibonacci extension from the highs of October 25th, 2021 to the lows of December 2nd, 2021 between 98.95 and 99.56. The 100.00 level also acts as psychological round number resistance. Notice that WTI broke the neckline of a double bottom in mid-January. The target for the double bottom is near 108.10.
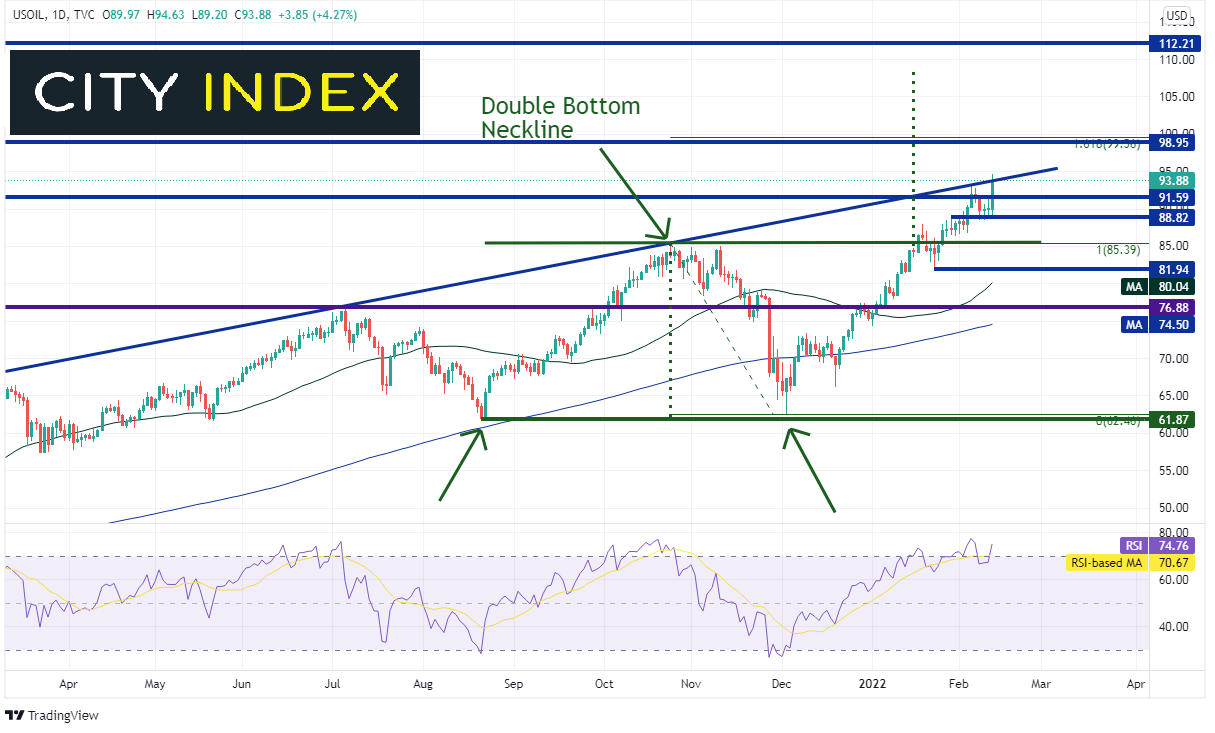
Source: Tradingview, Stone X
If the headlines increase that Russia will invade Ukraine this week, markets could see flows out of risky assets and into safe havens, such as the Yen, Swiss Franc, Gold and Bonds. Oil could also benefit from the headlines. However, history shows that upon an invasion, be careful of a “buy the rumor, sell the fact”, in which case prices would reverse and traders could be caught on the wrong side of the trade.
Learn more about forex trading opportunities.
Latest market news
Today 12:54 AM
Yesterday 08:00 PM
May 4, 2024 08:00 PM
Latest Trade Ideas articles

May 4, 2024 08:00 AM

May 3, 2024 07:49 AM

May 3, 2024 07:01 AM