


HSBC’s share price plummeted as the coronavirus outbreak spread, wreaking havoc on global economies and markets.
Q1 results
Q1 results provided an insight as to the damage that covid-19 is causing. Profits at the bank tanked amid a surge in money set aside for bad loans.
HSBC set aside $3 billion for bad loans, an increase of over 400% compared to the same period last year. This included a $600 million charge to cover the losses related to the collapse of Hin Leong Trading, one of Asia’s largest oil trading corporations.
Its also worth keeping in mind that this could just be the tip of the iceberg. HSBC warned that the $3 billion figure could rise further across the year, potentially to $7 - $10 billion. Clearly this would have a significant and material impact on profits; the $3 billion charge resulted in profits halving to $3.2 billion, revenue on the other hand dropped 5% to $13.7 billion.
One of the main differences between now and the Financial crisis, is the bank’s ability to absorb credit losses. Tier 1 capital ratio barely declined to 14.6% from 14.7%. However, this could fall further should provisions for bad loans rise.
Net Interest Income
With central banks slashing interest rates to historically low levels, bank’s NII is coming under pressure. NII at HSBC fell to 1.54% in Q1, down from 1.56% previously and down from 1.59% the previous year. Central banks are unlikely to start raising interest rates anytime soon, in fact there is significantly more chance of further cuts than any hikes, meaning downward pressure will remain on this revenue stream.
With central banks slashing interest rates to historically low levels, bank’s NII is coming under pressure. NII at HSBC fell to 1.54% in Q1, down from 1.56% previously and down from 1.59% the previous year. Central banks are unlikely to start raising interest rates anytime soon, in fact there is significantly more chance of further cuts than any hikes, meaning downward pressure will remain on this revenue stream.
Trading
Trading has been a brighter spot given the recent volatility in the markets amid the coronavirus crisis. However, the markets are now considerably calmer, meaning revenue is unlikely to get the same boost from trading going forward.
Trading has been a brighter spot given the recent volatility in the markets amid the coronavirus crisis. However, the markets are now considerably calmer, meaning revenue is unlikely to get the same boost from trading going forward.
Asia
HSBC will continue its pivot towards Asia under newly appointed CEO Noel Quinn, a sensible plan given that it makes most of its money in Asia. These plans are on hold for the covid-19 crisis; however, the plan is expected to pick up from where it left off.
HSBC will continue its pivot towards Asia under newly appointed CEO Noel Quinn, a sensible plan given that it makes most of its money in Asia. These plans are on hold for the covid-19 crisis; however, the plan is expected to pick up from where it left off.
Analysts Rating
There are 22 analyst covering HSBC :
There are 22 analyst covering HSBC :
- 4 Rate Buy
- 6 Neutral
- 12 Sell
Levels to watch:
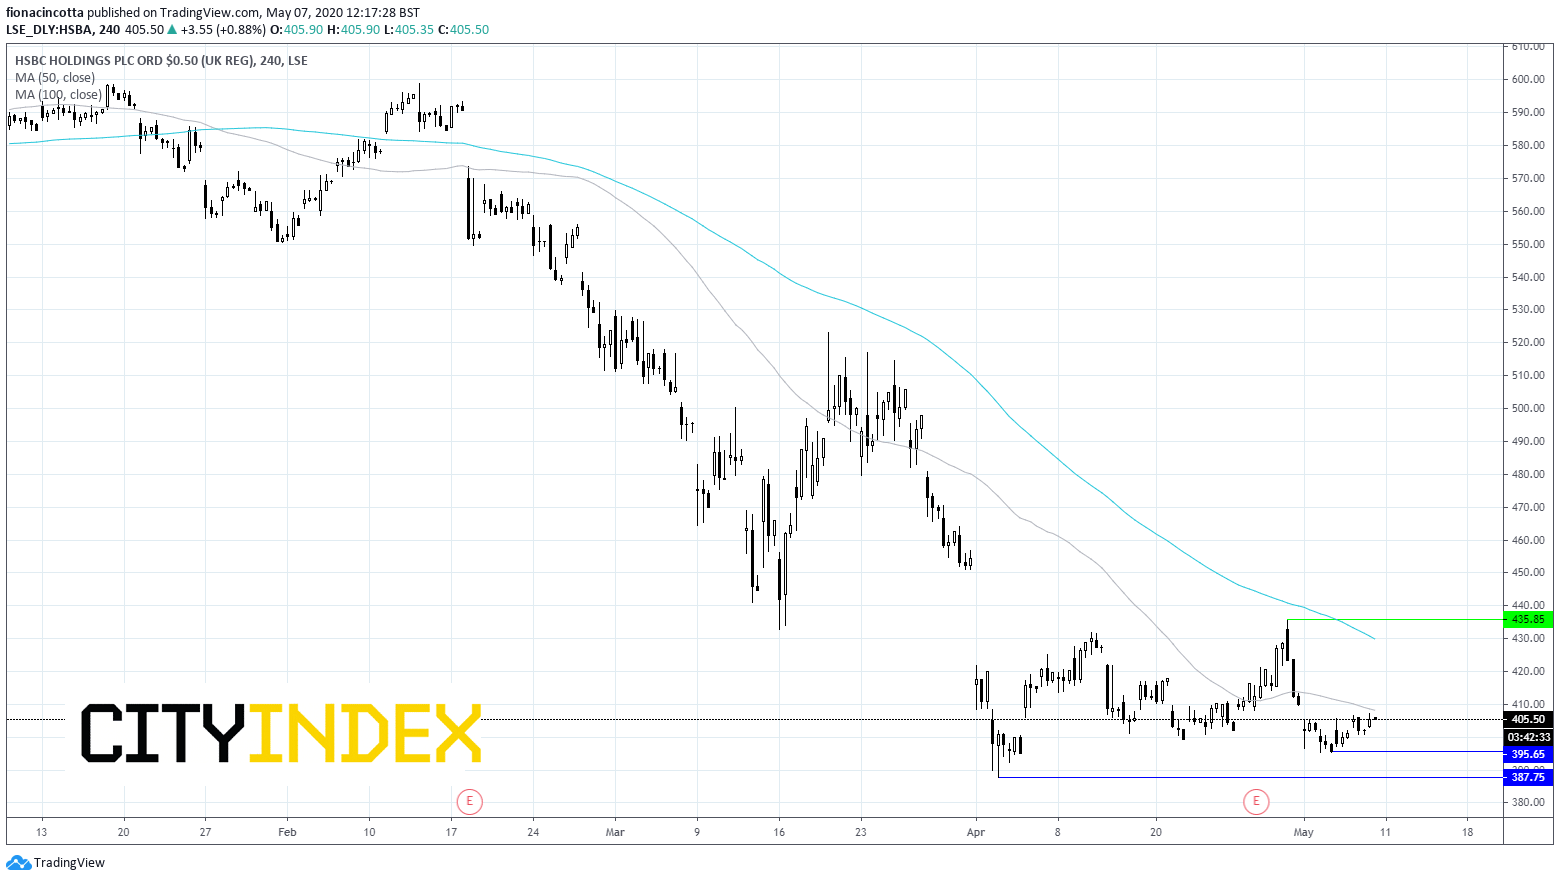
HSBC continues to trade around -31% down from its pre-coronavirus crisis 590p level in mid-February, as it underperforms the broader market. The FTSE is down -21% from its mid-February pre-covid-19 level. The bank has seen an anaemic bounce from its covid-19 low, gaining just 5%, compared to the FTSE’s 17% rally.
HSBC trades below its 50 & 100 sma on the 4-hour chart; a bearish chart.
Immediate resistance can be seen at 408p (50 sma) and 430 (100 sma). A move above the 430p could negative the down trend and see more bulls jump in, opening the door to 436p and 450p
Immediate support is 395p (low 4th May) prior to 387p (low 2nd April).
Latest market news
Today 11:14 AM
Today 08:28 AM
Yesterday 03:30 PM
Latest Equities articles
April 12, 2024 02:28 AM
April 7, 2024 08:46 PM
March 31, 2024 11:22 AM
