


From a chartist point of view, the stock price is currently challenging a key support area at 325
HSBC, Europe's biggest bank by assets, reported that 1H pre-tax tumbled 65% on year to 4.32 billion dollars (lower than 5.67 billion dollars expected), citing higher expected credit losses and other credit impairment charges (ECL). The Bank pointed out: "Reported ECL increased by 5.7 billion dollars to 6.9 billion dollars due to the impact of the Covid-19 outbreak and the forward economic outlook, and due to an increase in charges related to specific wholesale customers. (...) Reported profit in 1H20 also included a 1.2 billion dollars impairment of software intangibles, mainly in Europe."
From a chartist point of view, the stock price is currently challenging a key support area at 325: May 2012 and 2016 bottom, likely to trigger either a significant rebound or a bearish acceleration. Indeed, the weekly RSI is capped by a declining trend line while posting a bullish divergence: a potential bullish technical signal but not confirmed yet. As a consequence, below 370, traders may consider adding short position after a rebound in the 350 region to target 2012 low at 287. Alternatively, an upside breakout of 370 would help validating bullish signal on the weekly RSI (bullish divergence and upside breakout of the declining trend line) and trigger a significant recovery with a bullish acceleration towards April top at 435.
From a chartist point of view, the stock price is currently challenging a key support area at 325: May 2012 and 2016 bottom, likely to trigger either a significant rebound or a bearish acceleration. Indeed, the weekly RSI is capped by a declining trend line while posting a bullish divergence: a potential bullish technical signal but not confirmed yet. As a consequence, below 370, traders may consider adding short position after a rebound in the 350 region to target 2012 low at 287. Alternatively, an upside breakout of 370 would help validating bullish signal on the weekly RSI (bullish divergence and upside breakout of the declining trend line) and trigger a significant recovery with a bullish acceleration towards April top at 435.
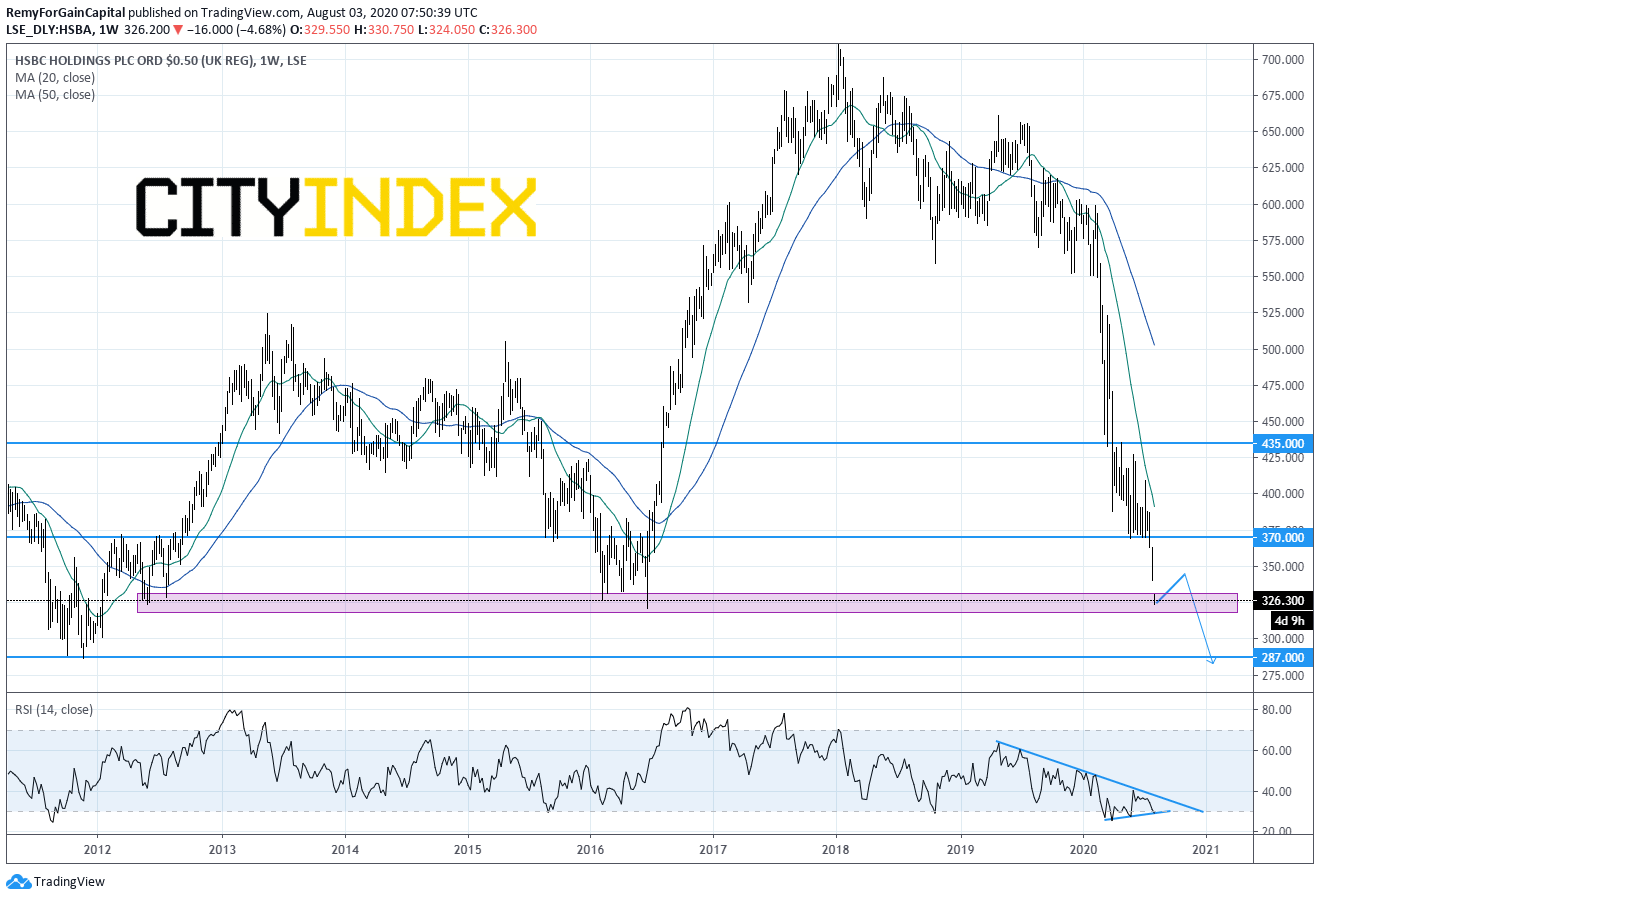
Source: GAIN Capital, TradingView
Latest market news
Latest Equities articles
April 12, 2024 02:28 AM
April 7, 2024 08:46 PM
March 31, 2024 11:22 AM
