


With oil prices exploding higher yesterday, we take a look at how WTI has performed following similar spikes of volatility.
By yesterday’s close, WTI futures enjoyed their 5th most bullish session according to Reuters data going back to December 1984. If prices are to remain elevated, it will surely put an extra strain on growth numbers as costs to consumers and businesses rise, which inadvertently brings along inflation. However, today we’ll look at how WTI prices traded higher levels of bullish volatility.
Please note, the table on the left shows the top 30 bullish days using close to close data, whereas the right hand chart shows the forward returns of the top 30 excluding yesterday’s close (so there will be minor differences between the two, although the underlying analysis remains consistent.
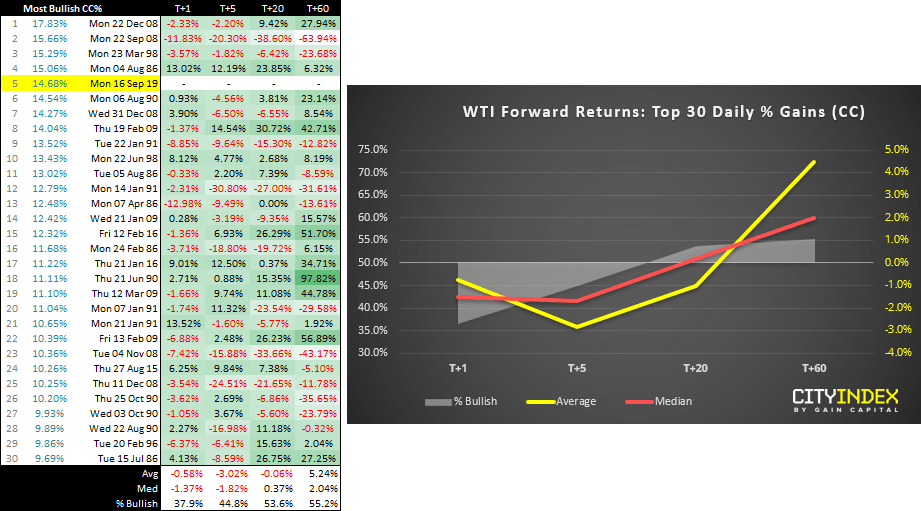
- It appears that bullish spikes don’t necessarily lead to bullish trends over the week following a bullish spike.
- Average returns were also bearish over 50% of the time, one week later.
- 20 days later (around 1 month) shows a positive expectancy for median prices, yet negative on average (so a few outliers have dragged the average down). However, average returns are bullish over 50% of the time.
- Average and median returns are clearly positive three months later, over 50% of the time.
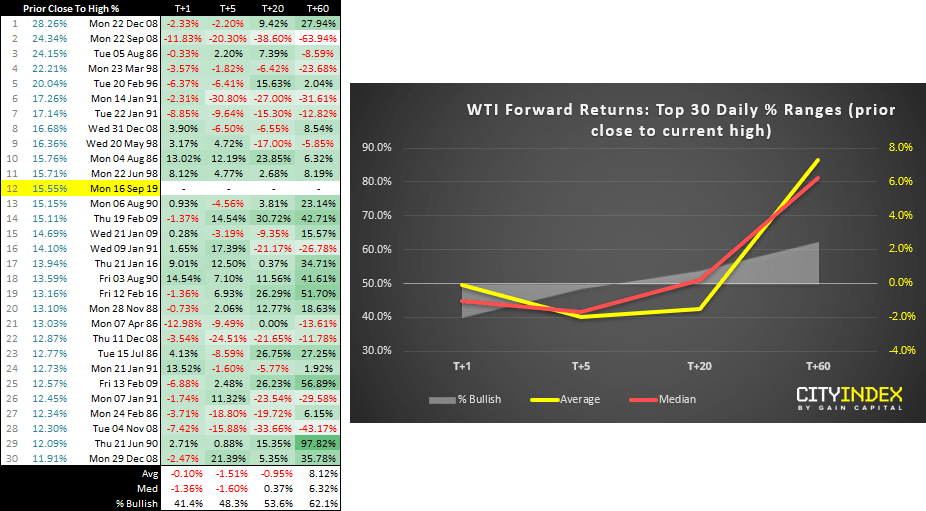
To look at the data in a slightly different light, we measured % gain from the prior close to the daily high. This is to better capture the volatility of the session, along with the initial gap higher. This places yesterday’s rally as the 15th most bullish session from the data set.
- The pattern remains similar, in that average and median returns are negative for up to a week after a bullish spike, whilst also producing bearish returns over 50% of the time.
- There’s a slight positive expectancy on median returns one month later, although average returns are again negative.
- Three months also shows a positive expectancy for average and median returns, over 50% of the time.
From this basic analysis, it appears that that bullish spikes haven’t favoured continued gains over the near-term but could signal a bullish resumption around 3 months later. In some ways this makes sense, as a price shock can lead to confusion and uncertainty, making prices vulnerable to whipsaws and / or retracements.
Related analysis:
Saudi Oil Attacks: WTI levels to watch
Oil ‘supply shock’ in context
WTI Flies High Following A Drone Attack On a Saudi Oil Facility
Latest market news
Yesterday 08:33 AM
Latest Crude Oil articles
April 17, 2024 05:00 PM
April 17, 2024 03:02 AM
April 10, 2024 06:07 AM