


How to chart NetEase and JD.com When It Is just Listing In Hong Kong Exchange
NetEase has started its secondary-listing on Hong Kong Exchange Since June 11. The stock trading in HKEX opened at HK$133 and then dropped around 6% to the recent low at HK$125.1 on Monday. Then, the stock prices rebound around 3% on June 16 due to the rise of the global market on that Federal Reserve said it would start buying individual corporate bonds.
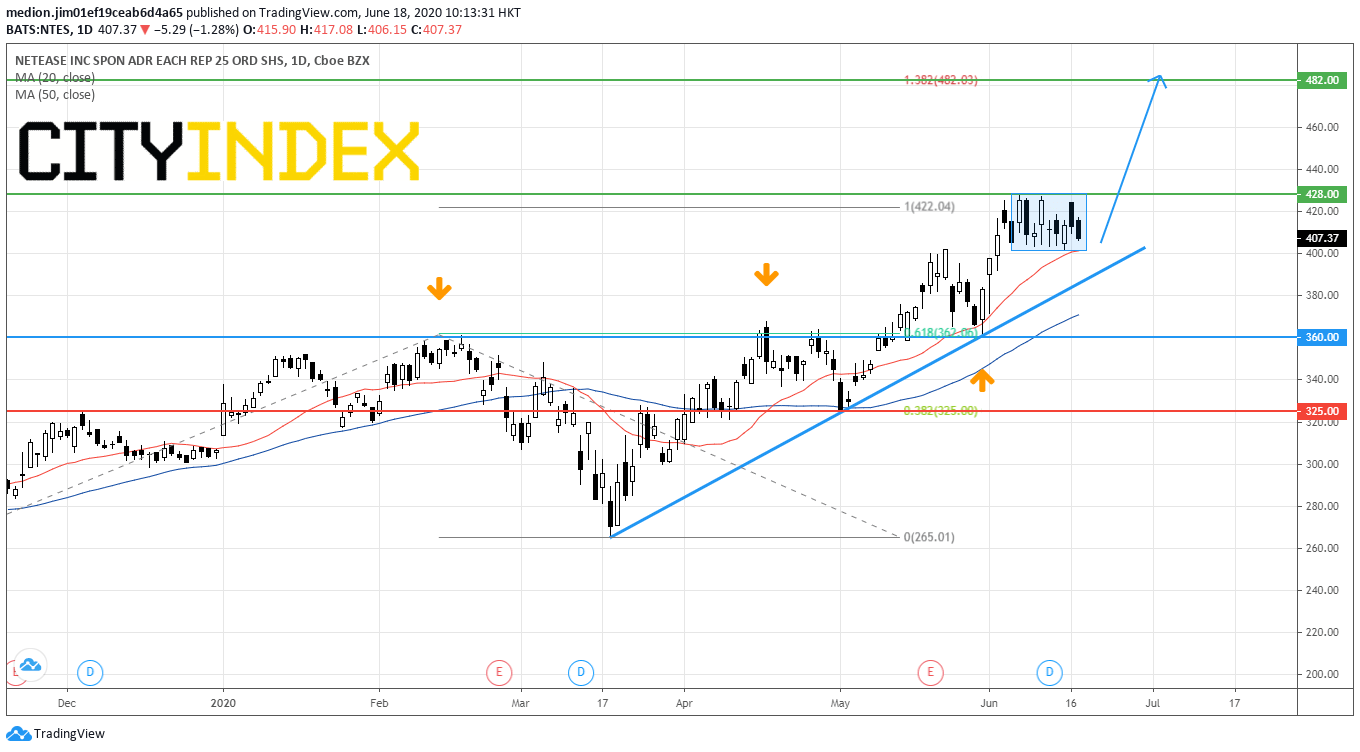
In fact, NetEase's ADR stock has a similar trend. It retreated around 5.8% from June 10 intraday high at $426.88 to June 11 to the low at $401.78 on Monday. Then, the prices rebound on Tuesday as well.
On a daily chart, NetEase's adr stock (NTES) is forming a consolidation zone between $402 and $428.
Currently, the stock prices remain supported by a bullish trend line drawn from March low and rising 20-day moving average, indicating a positive outlook.
As the prices do not change much, the support level remains at $360 (the previous low) and resistance levels would be located at $428 (recent high) and $482 (138.2% Fibonacci projection). A clear break above $428 would validate a bullish breakout of consolidation zone and call for a rise to $482.
Source: GAIN Capital, TradingView
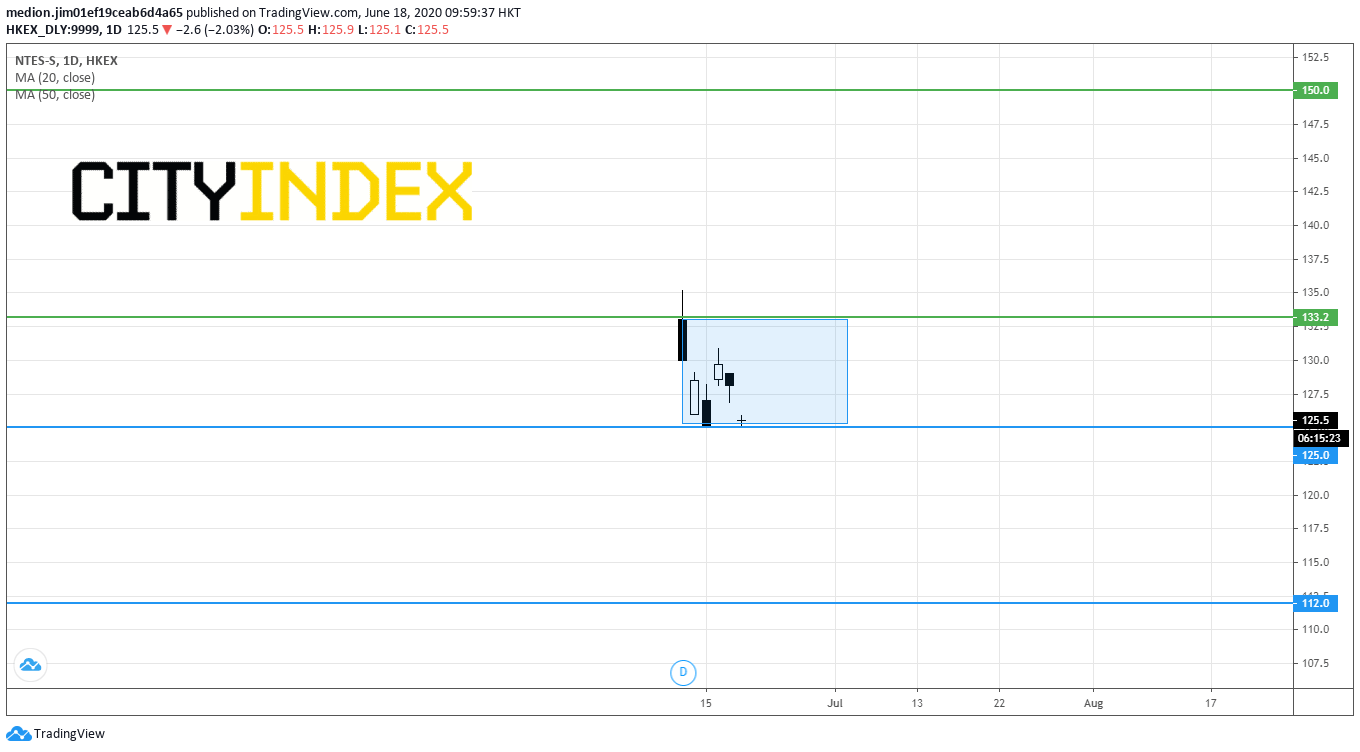
For technical analysis, as NetEase has similar movement when it trades in the U.S. and Hong Kong, we can convert the support and resistance levels from the U.S. market to Hong Kong's stock.
Source: GAIN Capital, TradingView
Therefore, we converted the major support level to HK$112, while resistance levels would be HK$133.2 and HK$150 respectively.
Currently, NetEase (9999.HK) drops around 2% and tests HK$125, which is around the lower boundary of consolidation zone level at $402, on the drop of the global market. Holding above HK$125 should consider a range bouncing to HK$133.20.
Notice that Hong Kong's Hang Seng Index is dropping around 1% as the U.S. and Europe failed to reach the agreement about the digital tax deal.
Alternatively, a break below HK$125 would trigger a deeper pullback. However, the level at HK$112 should provide support to the stock prices.
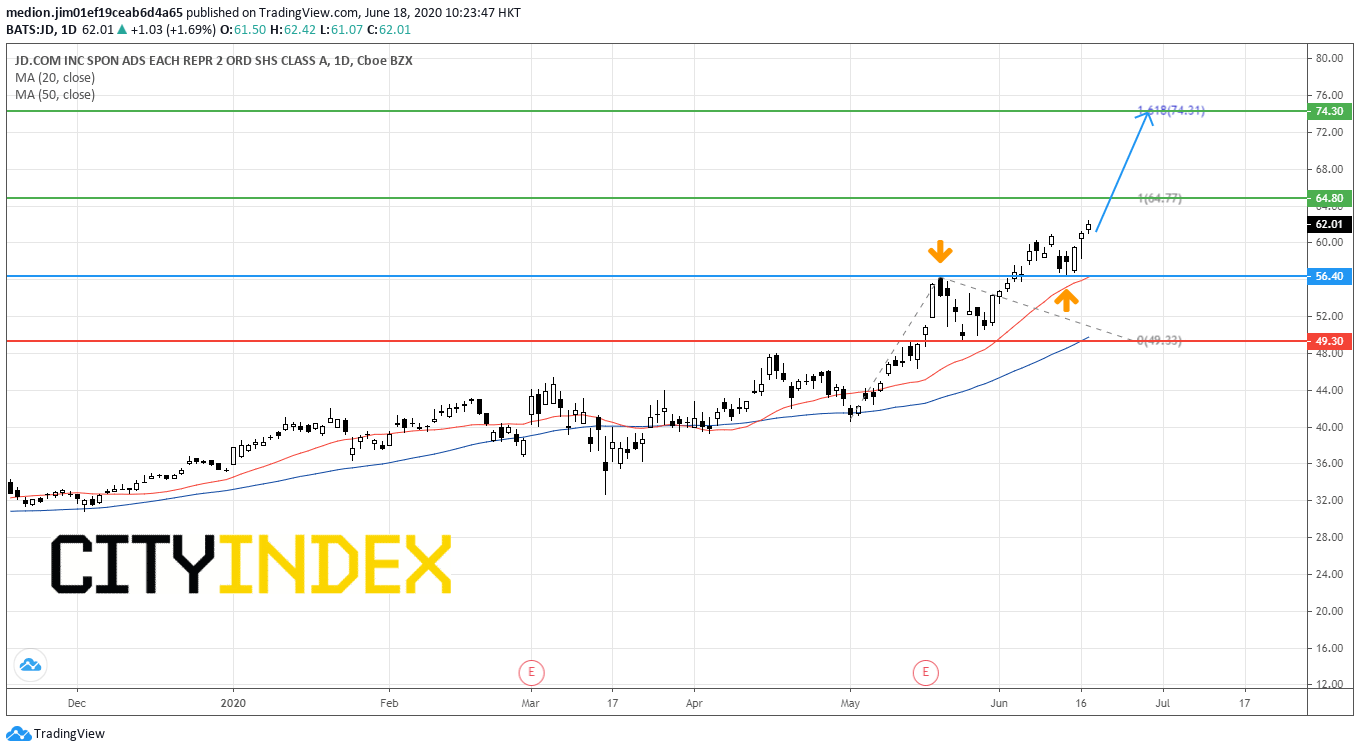
On a daily chart, JD.com 's ADR stock (JD) is extremely strong and makes a new record high. Currently, it's support level raised to the overlap support level at $56.40, which is around HK$220.
The resistance levels would be located at $64.8 (100% Fibonacci Projection) and $74.3 (161.8% Fibonnaci projection), which would convert to HK$252 and HK$289 respectively.
Source: GAIN Capital, TradingView
In fact, NetEase's ADR stock has a similar trend. It retreated around 5.8% from June 10 intraday high at $426.88 to June 11 to the low at $401.78 on Monday. Then, the prices rebound on Tuesday as well.
On a daily chart, NetEase's adr stock (NTES) is forming a consolidation zone between $402 and $428.
Currently, the stock prices remain supported by a bullish trend line drawn from March low and rising 20-day moving average, indicating a positive outlook.
As the prices do not change much, the support level remains at $360 (the previous low) and resistance levels would be located at $428 (recent high) and $482 (138.2% Fibonacci projection). A clear break above $428 would validate a bullish breakout of consolidation zone and call for a rise to $482.
Source: GAIN Capital, TradingView
For technical analysis, as NetEase has similar movement when it trades in the U.S. and Hong Kong, we can convert the support and resistance levels from the U.S. market to Hong Kong's stock.
Source: GAIN Capital, TradingView
Therefore, we converted the major support level to HK$112, while resistance levels would be HK$133.2 and HK$150 respectively.
Currently, NetEase (9999.HK) drops around 2% and tests HK$125, which is around the lower boundary of consolidation zone level at $402, on the drop of the global market. Holding above HK$125 should consider a range bouncing to HK$133.20.
Notice that Hong Kong's Hang Seng Index is dropping around 1% as the U.S. and Europe failed to reach the agreement about the digital tax deal.
Alternatively, a break below HK$125 would trigger a deeper pullback. However, the level at HK$112 should provide support to the stock prices.
For JD.com (9618.HK), today is the first day of its secondary listing in Hong Kong Exchange. We could use a similar method to convert it's ADR stock's support and resistance levels to Hong Kong's stock.
On a daily chart, JD.com 's ADR stock (JD) is extremely strong and makes a new record high. Currently, it's support level raised to the overlap support level at $56.40, which is around HK$220.
The resistance levels would be located at $64.8 (100% Fibonacci Projection) and $74.3 (161.8% Fibonnaci projection), which would convert to HK$252 and HK$289 respectively.
Source: GAIN Capital, TradingView
Latest market news
Latest Equities articles
April 12, 2024 02:28 AM
April 7, 2024 08:46 PM
March 31, 2024 11:22 AM
