Has the correlation between oil and USD CAD gone loonie
Despite this morning’s slight disappointment in Eurozone GDP (0.3% q/q vs. 0.4% expected), there hasn’t been too much movement in the foreign exchange markets as […]
Despite this morning’s slight disappointment in Eurozone GDP (0.3% q/q vs. 0.4% expected), there hasn’t been too much movement in the foreign exchange markets as […]
Despite this morning’s slight disappointment in Eurozone GDP (0.3% q/q vs. 0.4% expected), there hasn’t been too much movement in the foreign exchange markets as traders look ahead to a promising late summer weekend. Indeed, even a full slate of second-tier US data has failed to inject much volatility into the markets.
Recapping each of today’s US reports in order, the July Producer Price Index (PPI) came out slightly hotter than expected at 0.2% m/m vs. 0.1% eyed (Core PPI was even better at 0.3% m/m). Less than an hour later, the July Industrial Production report also came out strong at 0.6% m/m, double the 0.3% increase expected (Capacity Utilization came out in-line at 78.0%). Finally, the University of Michigan Consumer Sentiment report put a bow on this week’s economic data, coming out at 92.9, just below the anticipated 93.5 reading and 93.1 previously.
On balance, today’s US data was better than anticipated, but try telling that to frustrated USD/CAD bulls. Despite oil falling to a new 6.5-year low under 42.00 last night, the normally oil-correlated loonie has actually gained ground against its Southern rival this week (see chart below). It seems unlikely that this typically tight correlation has broken on a sustainable basis, so it will be interesting to see whether oil sees a notable bounce next week or whether the loonie depreciates meaningfully to “catch down” with the recent fall in black gold.
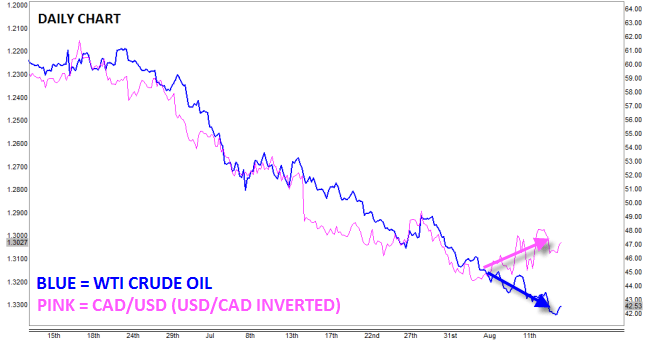 Source: City Index
*NOTE: Correlations can change, and there are other factors beyond the price of oil that impact USD/CAD.
Looking at USD/CAD in isolation, the chart is still generally constructive. The pair appears to be forming a bullish flag pattern over the last two weeks; for the uninitiated, this pattern is created by a strong rally, followed by a shallow, controlled pullback and, despite its name, it is only seen as a bullish if we see a breakout above the top of the flag around 1.3100 (and ideally, a break above the peak near 1.3200). Meanwhile, the RSI has pulled back from overbought territory, potentially clearing the way for another leg higher, but bulls desperately want to see a breakout early next week.
If rates are able to clear the top of the flag next week, a continuation toward the 11-year high at 1.3200 would be likely, with potential for a more substantial rally toward 1.3300 or 1.3400 possible as we move toward September. Meanwhile, a downside breakdown would suggest that a deeper pullback toward previous-resistance-turned-support at 1.2800 may be seen before the longer-term uptrend can resume.
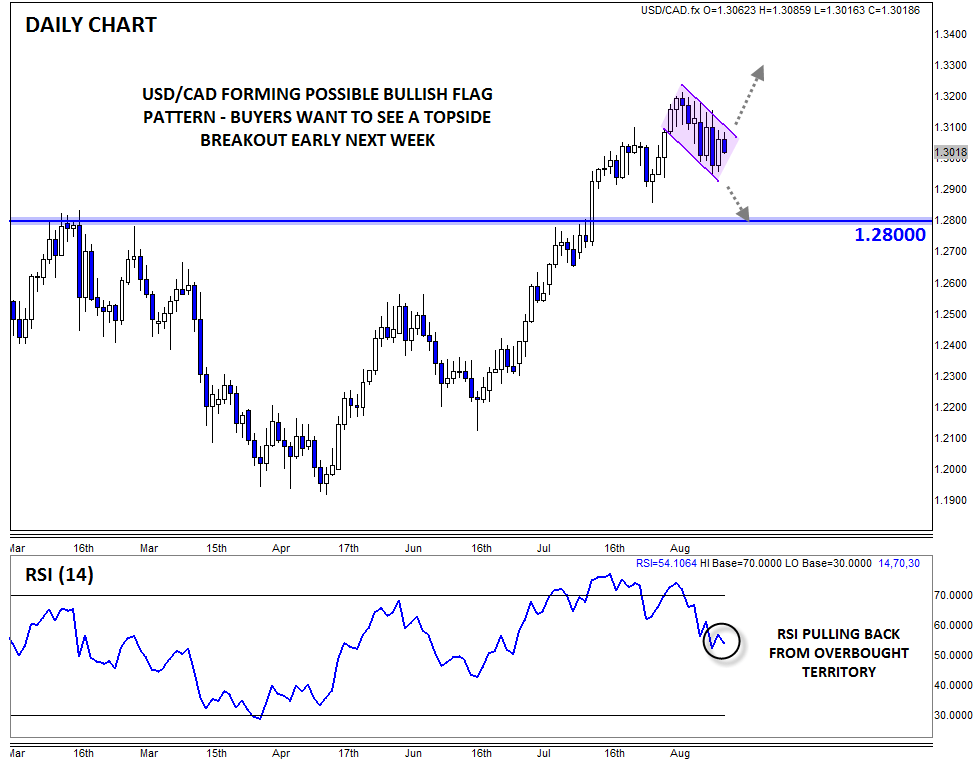 Source: City Index
