Has EUR USD resumed its upward trend
The EUR/USD has finally ended a run of six consecutive down days. So, is it about to resume its recent upward trend? Well, this will […]
The EUR/USD has finally ended a run of six consecutive down days. So, is it about to resume its recent upward trend? Well, this will […]
The EUR/USD has finally ended a run of six consecutive down days. So, is it about to resume its recent upward trend? Well, this will depend to some degree on the outcome of the upcoming data releases from both the US and the Eurozone. From the US, the key numbers to watch this week include import prices and the weekly unemployment claims data, both due for release on Thursday, followed by retail sales, PPI and consumer sentiment on Friday. Friday will also be an important day for the euro because that is when we will have the German and Eurozone first quarter GDP estimates.
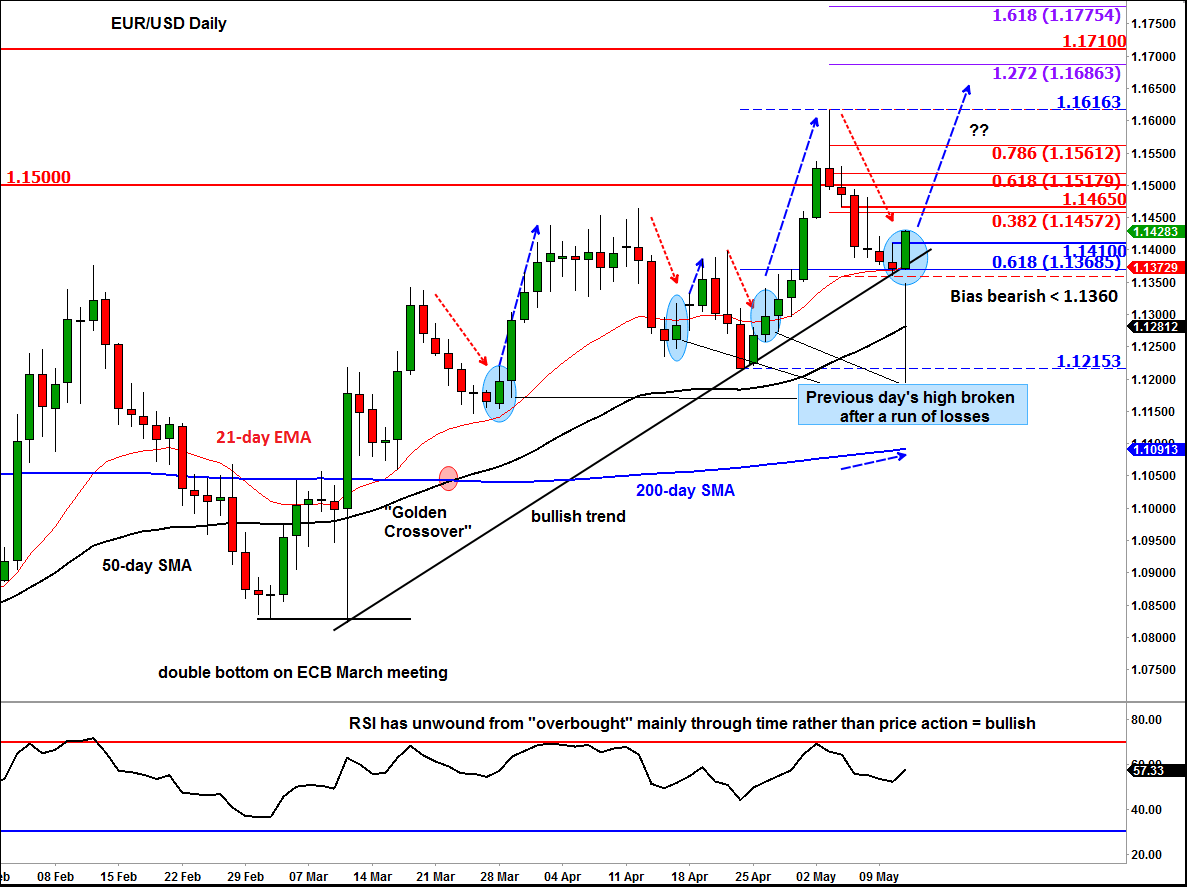
Ahead of the abovementioned data releases, the EUR/USD is displaying an interesting pattern on its daily chart. Yesterday, it found support at 1.1360/70, an area we highlighted in detail in the Live Trading Session webinar on Monday. As a reminder, this level marks the convergence of the 61.8% Fibonacci retracement of the most recent rally with a bullish trend line and the 21-day exponential moving average.
It is also likely that the sellers may have taken profit around 1.1360/70 given the conflux of so many technical indicators there. So this rally could be a combination of both profit-taking from the sellers and fresh buying interest from the bulls.
Whatever the cause, the world’s most heavily-traded FX pair has now moved above resistance and yesterday’s high at 1.1410. It has broken above the ‘prior day’s high’ for the first time in seven days. This development may trigger further follow-up technical momentum buying interest.
In the previous four occasions when the prior high was taken out following a run of consecutive daily losses had occurred, the EUR/USD went on to rise for the next 2-6 days. If this trend repeats itself again then the EUR/USD may well surpass the 1.15 handle and possibly rise towards the August 2015 high at 1.1710 next.
Indeed, the underlying trend is still bullish as indicated for example by the still-rising moving averages and the bullish trend line. The only significantly bearish technical indication to consider is last week’s potentially false breakout above 1.15, when the weekly chart formed a bearish-looking inverted hammer candlestick.
With that in mind, traders should treat the short-term potential resistance levels on the EUR/USD with a degree of caution (as the longer-term trend may have turned bearish once again), starting with the 1.1450-65 area – previous resistance and 38.2% Fibonacci retracement against the most recent high.