


Short-term technical outlook on Hang Seng Index/Hong Kong 50
click to enlarge charts
Key Levels (1 to 3 days)
Pivot (key support): 26400/300
Resistances: 26700 & 26870/950
Next support: 26000
Directional Bias (1 to 3 weeks)
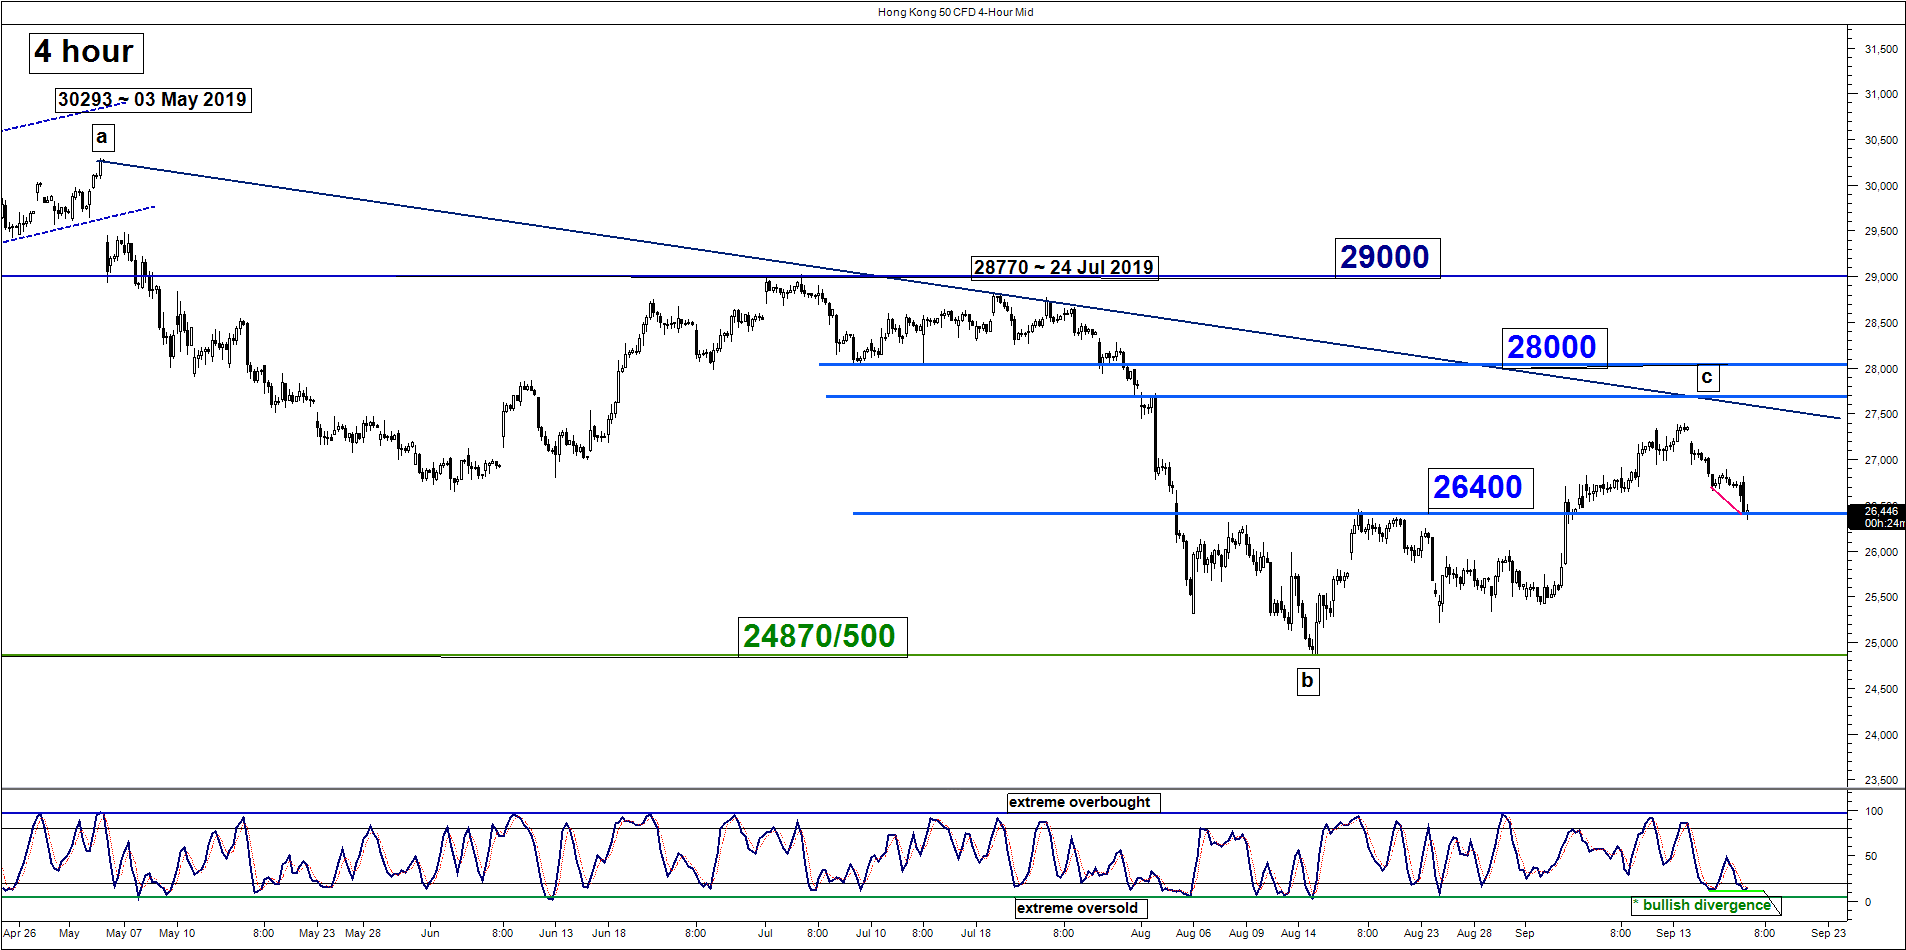
Since the start of this week, the Hong Kong 50 Index (proxy for Hang Seng Index futures) has underperformed the rest of its peers (S&P 500, Nikkei 225, ASX 200 & DAX), it has staged a decline of -3.8% from its 13 Sep 2019 swing high to print a current intraday low of 26348 as seen in today, 19 Sep Asian.
Interestingly, today’s current intraday low of 26348 confluences with the predefined medium-term neutrality range support of 26400 as per highlighted in our weekly technical outlook earlier on this Mon (click here for a recap).
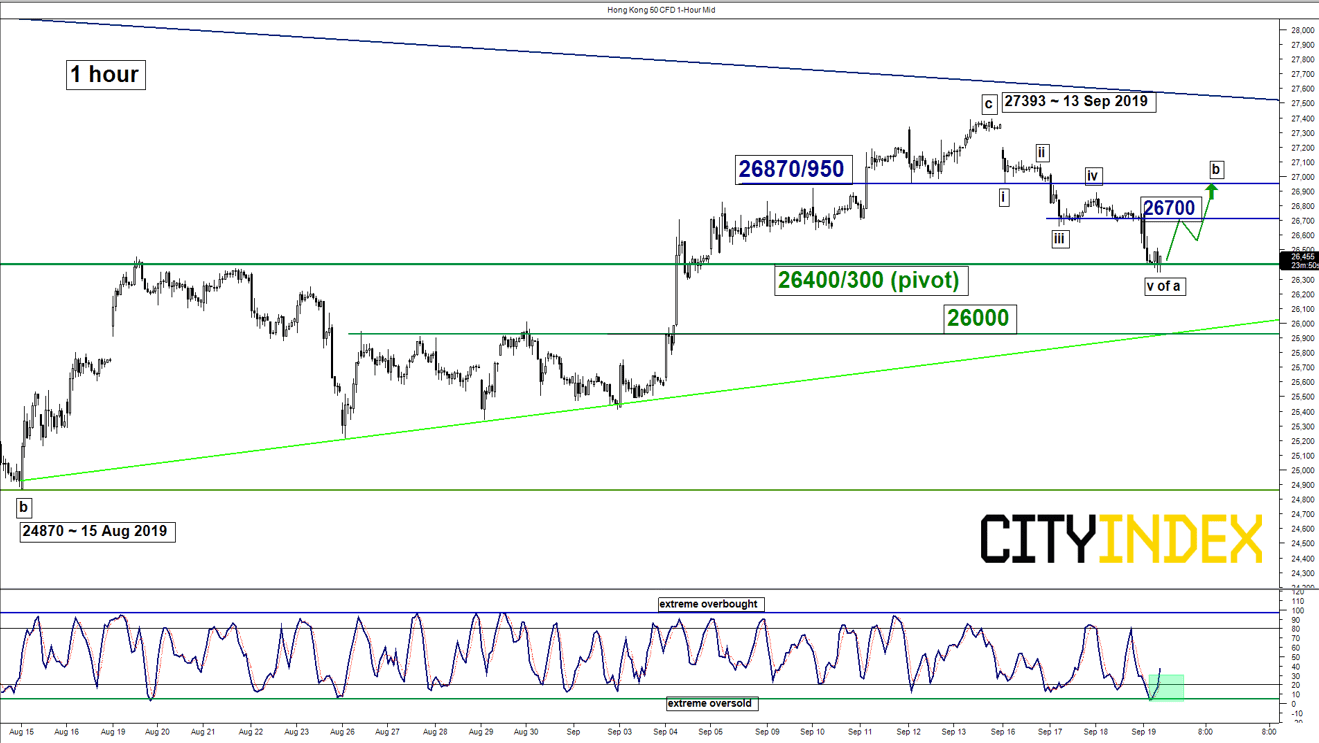
Short-term elements have turned positive where the Index is likely to stage a minor reversion rebound (1-3 days) towards the next intermediate resistances at 26700 and 26870/950.
On the other hand, failure to hold at 26400/300 pivotal support invalidates the mean reversion rebound scenario for an extension of the slide towards the next support at 26000 (the former swing high areas of 26 Aug/30 Aug 2019 & the ascending support from 15 Aug 2019 low).
Key elements
- Elliot Wave/fractal analysis suggests that the Index has traced out a minor degree 5-wave downleg sequence (i, ii, iii, iv & v) from 13 Sep 2019 high of 27393 with the ending 5th wave target at 26300 (0.764 Fibonacci projection of the recent decline from 13 Sep high to 17 Sep low; length of wave iii projected to 19 Sep 2019 high, the high of wave iv). The projected 5th wave target of 26300 confluences with the medium-term range support of 26400 which increases the probability of a rebound at this juncture.
- Momentum analysis also advocates for a rebound scenario where the 4-hour Stochastic oscillator has traced out a bullish divergence signal at its oversold region and the 1-hour Stochastic oscillator has just exited from its oversold region. These observations suggest that the recent downside momentum has been “overstretched”.
- The significant intermediate resistance stands at 26870/950 with is defined by the former minor congestion area of 12 Sep/16 Sep 2019 and the 50% Fibonacci retracement of the recent decline from 13 Sep to today, 19 Sep 2019 intraday low.
Charts are from City Index Advantage TraderPro
Latest market news
Today 11:14 AM
Today 08:28 AM
Yesterday 03:30 PM
Yesterday 01:23 PM
Latest Indices articles
Yesterday 03:30 PM
April 18, 2024 04:46 PM
April 17, 2024 11:00 AM
April 16, 2024 08:00 PM