


It’s amazing how quickly markets can move.
At the end of last week, traders were almost fully pricing in a 50bps “double” rate hike from the Fed at its March meeting following hawkish comments from St. Louis Fed President James Bullard. Now, with the release of the minutes from the FOMC meeting in late January, the market-implied probability of a 50bps rate hike in March has fallen below 45%.
In explaining the precipitous drop in the market’s expectations, it all comes down to expectations and timing. After Bullard’s comments, traders were eager to see if the other FOMC voters felt similarly, but the minutes, as they often do, showed a conservative central bank that wanted to remain as data-dependent as possible and avoid pre-committing to any specific policy changes. Highlights from the minutes are below:
- A FEW PARTICIPANTS NOTED THAT ASSET VALUATIONS WERE ELEVATED ACROSS RANGE OF MARKETS, RAISING CONCERN THAT MAJOR REALIGNMENT COULD CONTRIBUTE TO FUTURE DOWNTURN
- PARTICIPANTS ANTICIPATED THAT IT WOULD SOON BE APPROPRIATE TO RAISE THE TARGET RANGE FOR RATES
- SIGNIFICANT BALANCE SHEET CUT LIKELY APPROPRIATE
- MOST PARTICIPANTS PREFERRED TO BRING ASSET PURCHASES TO AN END IN EARLY MARCH
- A COUPLE OF PARTICIPANTS FAVORED ENDING ASSET PURCHASES SOONER TO SEND AN EVEN STRONGER SIGNAL THAT THE COMMITTEE WAS COMMITTED TO BRINGING DOWN INFLATION
In other words, there were no “bombshells”; the central bank’s intentions as of its January meeting were the same as traders had expected and priced in. With no immediate signs that the Fed was looking to accelerate its long-espoused plans to end asset purchases in March and start raising interest rates then, the US dollar edged lower while US indices fought their way back toward breakeven levels to erase the morning’s losses.
Gold technical analysis
Turning our attention to gold, it’s not surprising to see the yellow metal rallying as the US dollar falls; after all, gold is denominated in US dollars, so, all else equal, a drop in the value of the greenback means it will take more US dollars to buy an ounce of gold.
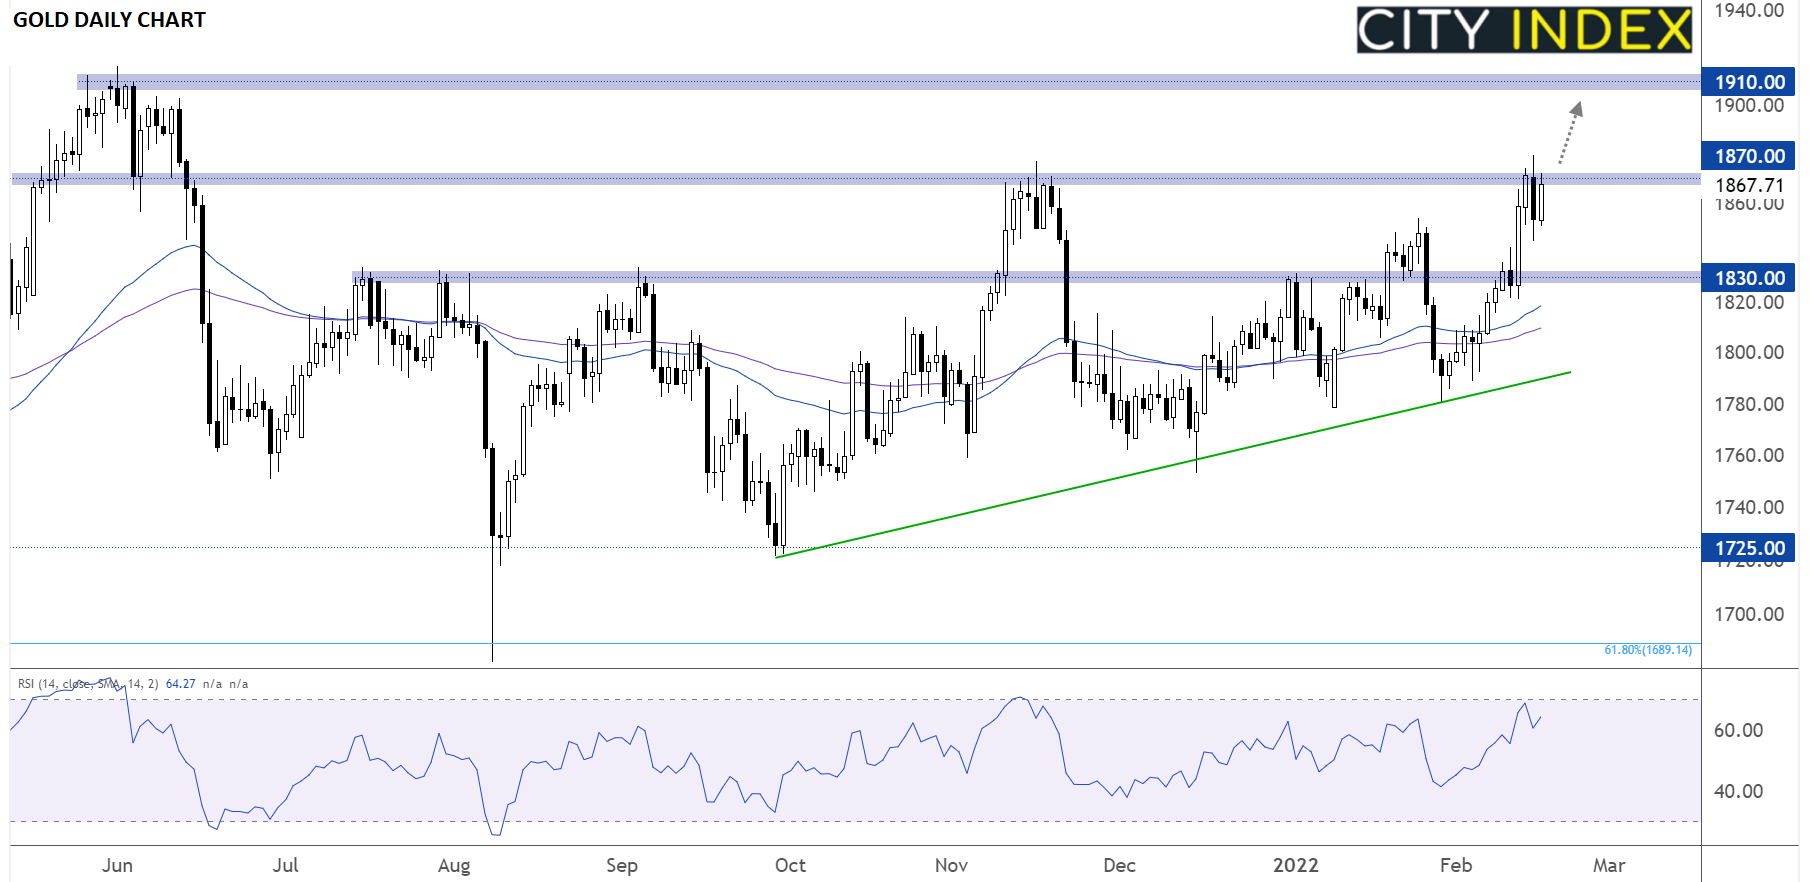
That said, the recent rally in precious metals extends beyond just this week’s slight weakness in the US dollar. With inflation remaining stubbornly high (and real interest rates relatively low), gold is well-positioned to benefit from a macroeconomic perspective. Indeed, gold has rallied for 10 of the past 13 days to test its highest level in eight months this week:
Source: TradingView, StoneX
Looking ahead, a confirmed break above horizontal resistance in the $1870 area would open the door for a continuation toward the post-COVID highs above $1910 next. Meanwhile, even a bearish reversal off previous-support-turned-resistance at $1870 could quickly find support at the 50-day EMA and previous resistance area around $1830 given the supportive macro backdrop.
How to trade with City Index
You can trade with City Index by following these four easy steps:
-
Open an account, or log in if you’re already a customer
• Open an account in the UK
• Open an account in Australia
• Open an account in Singapore
- Search for the company you want to trade in our award-winning platform
- Choose your position and size, and your stop and limit levels
- Place the trade
Latest market news
Today 08:33 AM
Yesterday 11:48 PM
Yesterday 11:16 PM


