Gold technical analysis projections for 2014
What were the key gold price movements during 2013? Gold (a daily chart of which is shown) has spent the majority of 2013 in one […]
What were the key gold price movements during 2013? Gold (a daily chart of which is shown) has spent the majority of 2013 in one […]
Gold (a daily chart of which is shown) has spent the majority of 2013 in one unmistakable direction – to the downside.
From the beginning of the current downtrend below the 1800 resistance high in October 2012, the precious metal has generally depreciated: sometimes dramatically and at other times interrupted by sharp pullbacks to the upside.
Overall, since that October 2012 high, gold has sustained heavy pressure to the downside.
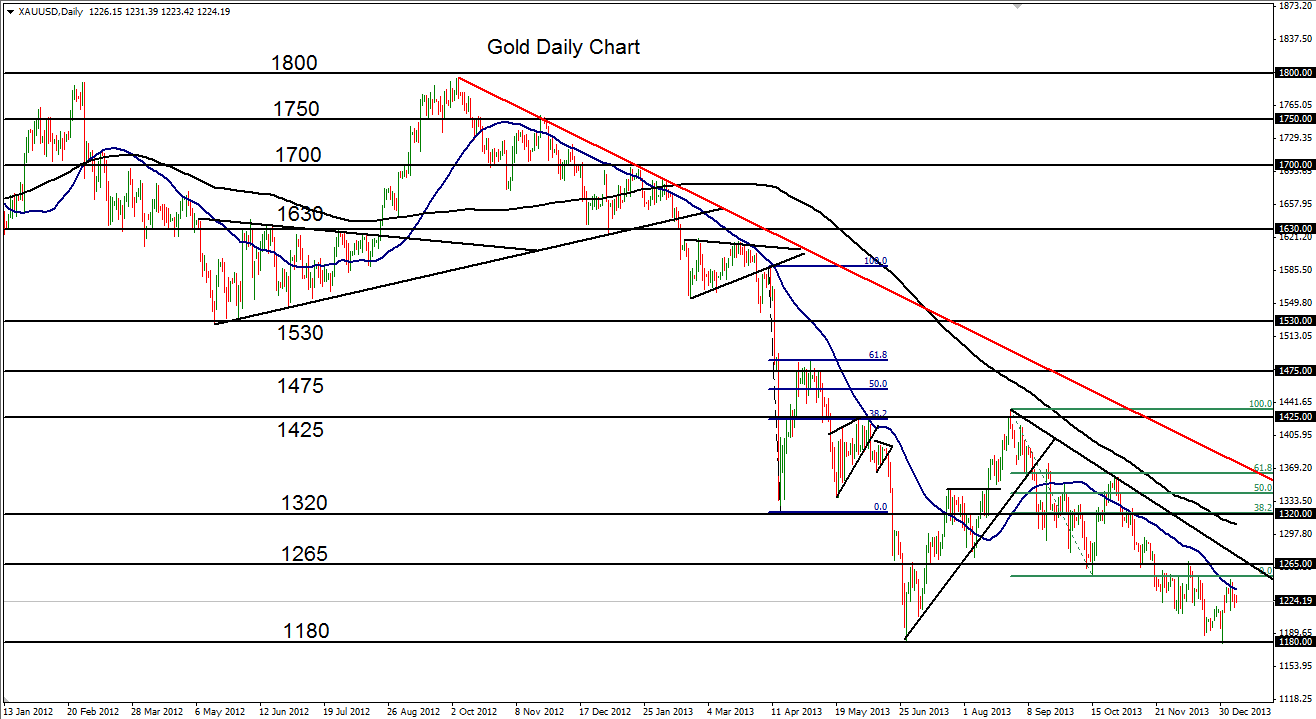
After dropping to progressively lower lows throughout the first half of 2013, a low extreme at 1180 was established in late June, hitting close to a three-year low for the precious metal. The next two months saw a substantial correction that brought price up to an intermediate peak of 1433 in late August.
From that high, price dropped down to a low of 1251 in mid-October before pulling back up two-weeks later to 1361, which was the 61.8% Fibonacci retracement of the prior bearish leg.
After that upside pullback, gold fell sharply on its way towards its major downside objective – the noted 1180 multi-year low established in late June.
The very end of 2013 saw price re-test that low, establishing more than a three-year low at 1178 on the last day of the year.
The beginning of 2014 saw a minor pullback to the upside that has so far failed to overcome the strong bearish pressure.
The current bearish environment is reinforced by the price of gold being slightly below its 50-day moving average which is, in turn, well below its 200-day moving average. Both of these averages are pointing decisively to the downside.
Moving further into 2014, a continued bearish environment should potentially prevail for gold.
Any further breakdown below the 1178 low would confirm a continuation of the sustained bearish trend that has been in place since the noted October 2012 1800-area high.
A breakdown below 1178 could then potentially position gold to target further downside around the 1000 psychological support level.
Upside resistance within the current bearish environment continues to reside around the major 1265 resistance area.
Interested in what the year might bring for the major currency pairs? Check out the other articles in this series:
GBP/USD forecast for 2014
EUR/USD forecast for 2014
USD/JPY forecast for 2014
AUD/USD forecast for 2014
