Gold surges to four month high
Gold (daily chart shown below) has surged to a four-month high, continuing the short-term bullish trend that has been in place since the beginning of […]
Gold (daily chart shown below) has surged to a four-month high, continuing the short-term bullish trend that has been in place since the beginning of […]
Gold (daily chart shown below) has surged to a four-month high, continuing the short-term bullish trend that has been in place since the beginning of the year.
The current price ascent represents follow-through on a rebound and partial recovery from the four-year low of 1130 that was hit in early November.
After that long-term low was hit, the precious metal spent the rest of 2014 struggling to recover from those depths and forming a large triangle consolidation pattern in the process.
The start of 2015 saw an almost immediate rise that has sustained itself thus far, two weeks into the New Year.
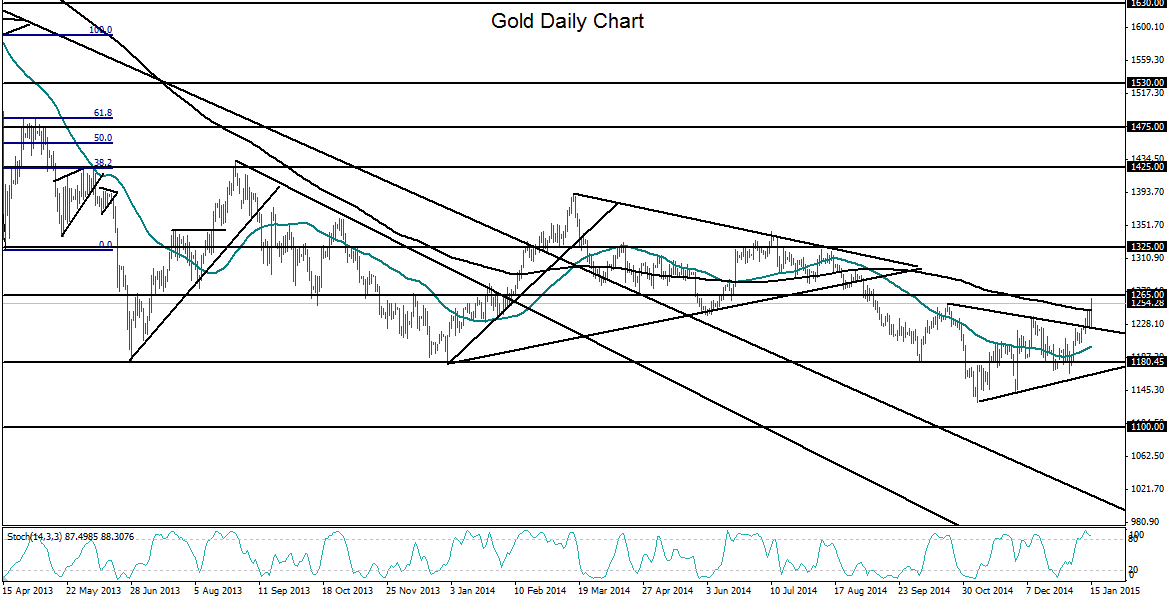
The beginning of the current trading week saw a price breakout above the triangle pattern, and Thursday’s price action has further extended gold’s climb above its 200-day moving average for the first time since August of 2014.
Having now climbed by around 11% since the noted November low of 1130, gold could now be asserting a renewed recovery mode. The next resistance level immediately to the upside resides around the 1265 area. Any breakout above that resistance could prompt the metal to begin targeting the 1300 and then 1345 price objectives.
