Gold surges in sharp rebound
June 20, 2014 – Gold (daily chart shown below) has surged up to a high just under key resistance around the 1325 level in a […]
June 20, 2014 – Gold (daily chart shown below) has surged up to a high just under key resistance around the 1325 level in a […]
June 20, 2014 – Gold (daily chart shown below) has surged up to a high just under key resistance around the 1325 level in a sharp rebound from the early June low of 1240.
This quick climb has broken swiftly above an area where the 50-day and 200-day moving averages have converged.
This convergence of moving averages last occurred in mid-March, when the precious metal had climbed to a high of 1392 before it began its steady decline for the past three months.
The 50-day moving average had been acting as a key resistance factor during much of this decline, as price action had appeared poised to drop back down towards its multi-year lows around 1180.
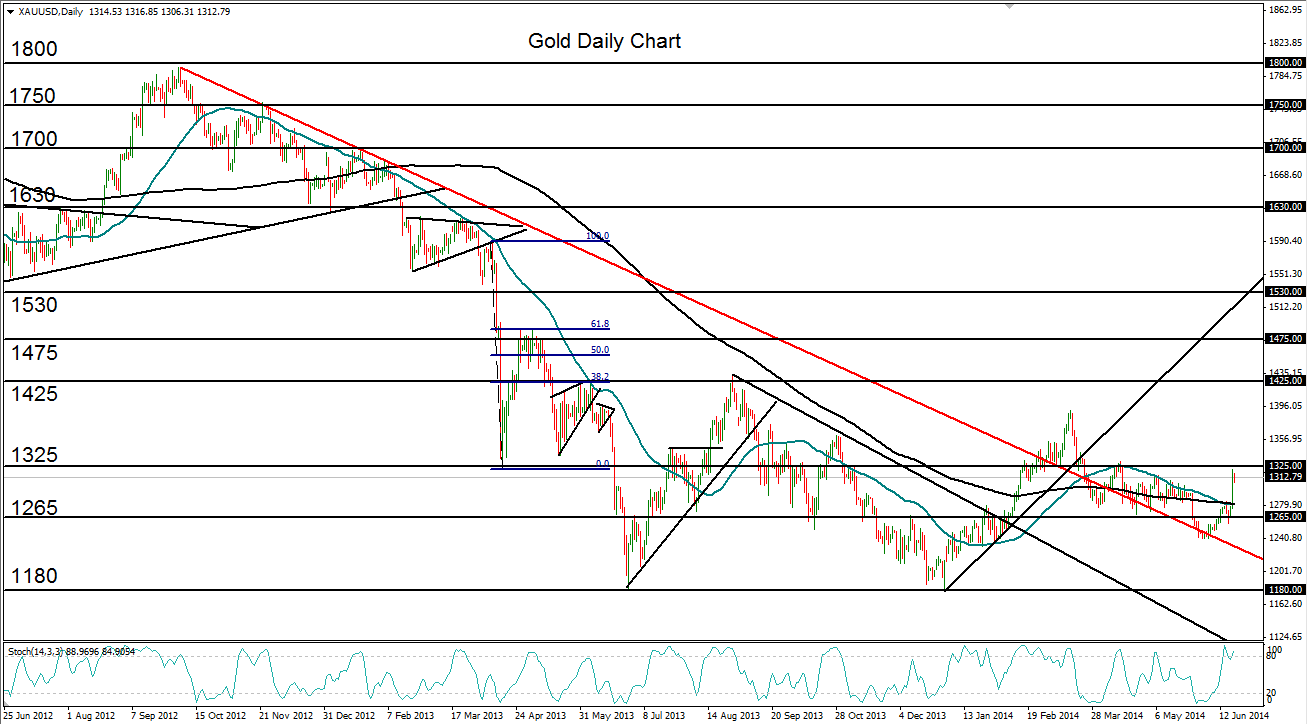
Having just rebounded from the recent 1240 low and approached the noted 1325 resistance area before pulling back slightly, the price of gold has swiftly recovered almost half of the losses it suffered during the past three months.
With any continued upside momentum that ultimately breaks out above the 1325 level, the major upside targets reside around the March 1390-area high and then the key 1425 resistance level.
Short-term downside support on any failure to follow-through to the upside currently resides around the 1280 level, in the area of the noted moving average convergence.
