Gold s next move could be huge but which direction
Gold ended last week only marginally lower thanks to Friday’s noticeable bounce which saw the precious metal momentarily surpass the $1100 handle. Friday’s counter-trend move […]
Gold ended last week only marginally lower thanks to Friday’s noticeable bounce which saw the precious metal momentarily surpass the $1100 handle. Friday’s counter-trend move […]
Gold ended last week only marginally lower thanks to Friday’s noticeable bounce which saw the precious metal momentarily surpass the $1100 handle. Friday’s counter-trend move was partly in response to news that the second quarter US Employment Cost Index (ECI) showed a very small rise of 0.2% in wage pressure. Traders responded to the data by booking some profit on their long dollar and short gold positions as the month drew to a close. Nevertheless, the yellow metal still ended the month of July with a huge 6.5% loss, which represented its biggest monthly decline since June 2013 when it had dropped by a whopping 12 per cent.
As the new week begins, the precious metal is finding itself back in the more familiar territory of around $1090. Despite the weaker ECI report on Friday and today’s overall weaker-than-expected US macro numbers, gold traders remain wary of a potential rate hike in as early as September or December. They argue that the strong recovery in the US labour market, if sustained, may ultimately put upward pressure on wages and in turn on prices in the coming months. In anticipation of this possibility, the Fed may start tightening monetary policy sooner rather than later so as to reduce the risks of overcooking inflation. But at the moment, inflation is running at extremely low levels across the globe which is another reason why gold is not doing that well. Indeed, the metal is coming under pressure from all angles. Not only has the physical demand from China been weak but optimism among money managers in the paper market is also falling. This is evidenced, for example, by another 8 per cent increase in net short positions in the week to 28 July, according to the CFTC.
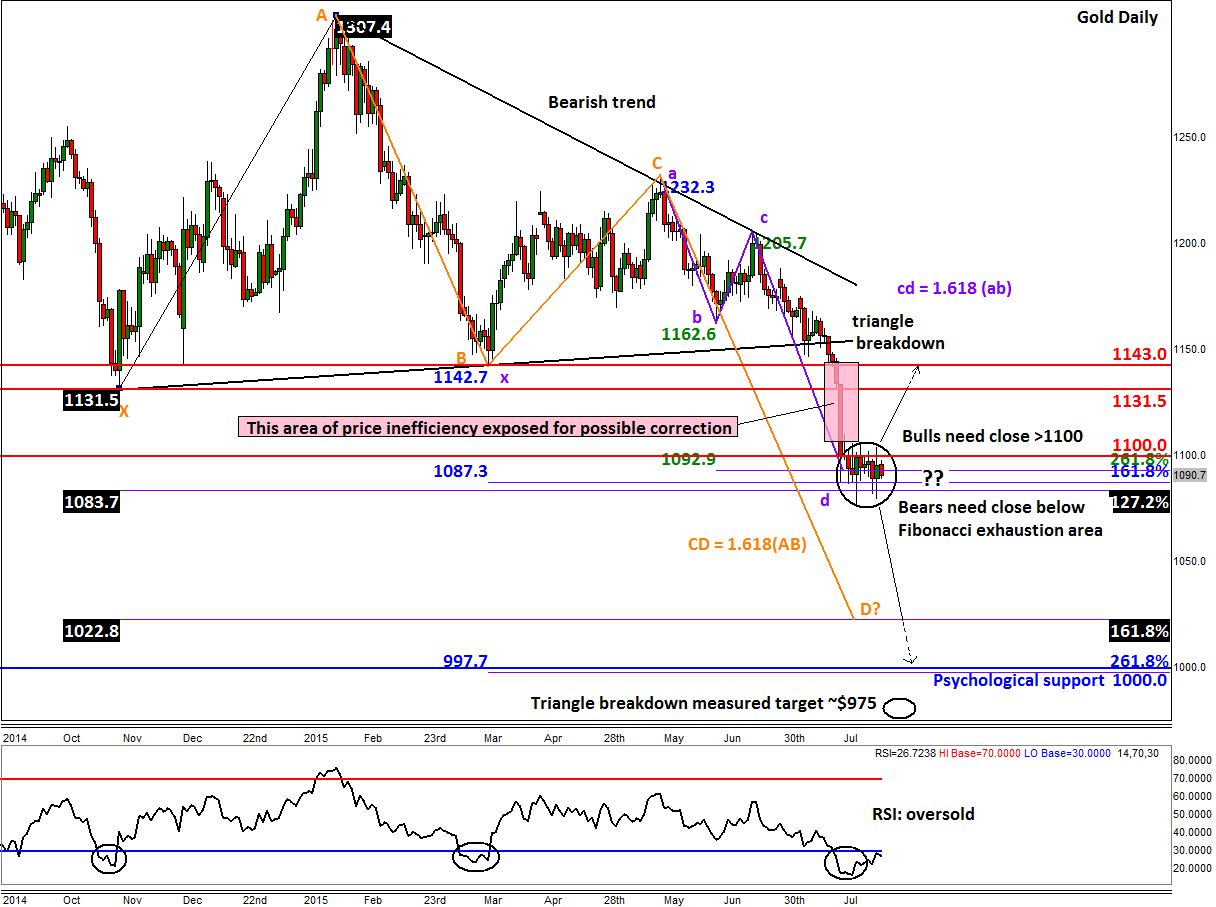
With short gold positions being at a fresh record high, the correction potential is also very high now. For gold to stage a noticeable rally, it will first have to climb above the resistance level of $1100 and hold there on a closing basis. This could happen given that the metal has already reached a Fibonacci extension area between $1083 and $1093. As the RSI is also at an oversold level of below 30, this area thus marks a potential exhaustion point for gold. If gold does correct from here, it may go on to ‘fill’ the area of inefficiency that was created as a result of the sell-off last month (highlighted in red). Consequently, gold could rally towards the old broken supports at $1131.5 or $1143.0, levels that could then turn into resistance.
That being said, sentiment is very bearish on gold and it wouldn’t take much to push the price of the yellow metal below the aforementioned Fibonacci exhaustion area on a daily closing basis. If seen, this may give rise to further follow-up technical selling which could see the metal drop viciously towards the next Fibonacci extension level at $1023 (161.8% extension of the XA swing) where it will also meet the extended point D of an AB=CD pattern. Thereafter is the psychologically-important level of $1000 and then the triangle breakdown measured target around $975.00.
So, gold’s next move could be a sharp one once it breaks out of the recent consolidative range. We could see this breakout at some point this week’s as more US labour market indicators are released prior to Friday’s official jobs report, causing the dollar and in turn gold to move sharply.