Gold s hesitation unnerving weaker bulls
Gold was little-changed at the time of this writing on Tuesday evening, unable to find support from the sell-off in stocks or indeed the weaker […]
Gold was little-changed at the time of this writing on Tuesday evening, unable to find support from the sell-off in stocks or indeed the weaker […]
Gold was little-changed at the time of this writing on Tuesday evening, unable to find support from the sell-off in stocks or indeed the weaker US dollar. At the same time, it wasn’t exactly following the other commodities either, with oil and copper prices making sharp U-turns in mid-day.
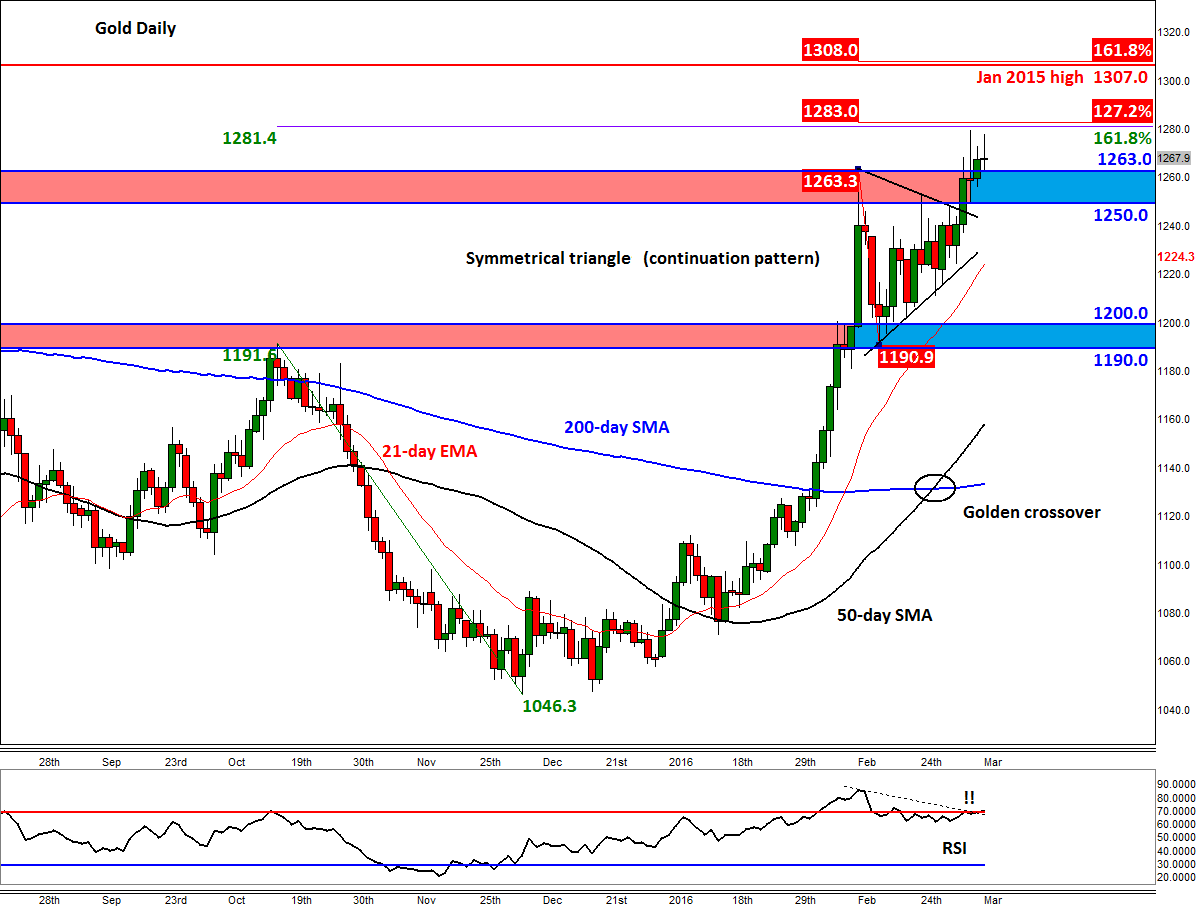
Despite its recent hesitation, gold has risen sharply ever since hitting a multi-year low of $1046 in December. At just shy of $1270 per ounce, the precious yellow metal is now up more than 20 per cent from that low. It has found support from various sources, including the fact that benchmark government bond yields have been falling to fresh negative levels amid the on-going fiat currency devaluation by major central banks. The slowing down of economic growth in China and raised uncertainty about the stock markets has also boosted the appetite for the safe haven metal. Added to this, physical demand for gold has been very healthy especially from Chinese and Indian consumers, as well as central banks.
From a technical perspective, gold is continuing to make good progress, but the slowing pace of the rally is beginning to cause a few concerns for short term bullish speculators. Following last Thursday’s breakout from a symmetrical triangle, which is a continuation pattern, the resulting rally has been only modest thus far. Friday’s doji candlestick pattern reflects this indecisiveness perfectly at the top of the range. This is not a great sign, not when the RSI is also forming a bearish divergence around the “overbought” threshold of 70. The RSI may need to unwind now and this will happen either by price action or by time. In this regard, it will be very bullish if gold holds at these high levels while the RSI drifts lower.
But gold has been making higher highs and higher lows, and is still (just about) holding above broken resistances such as $1250 and now $1263. However if these levels start to break down then the sellers’ control will increase, potentially causing the precious metal to retreat back towards the $1190-$1200 support area, or even towards the 50- or 200-daily moving averages at $1158 and $1134 respectively.
However these moving averages are now in the “right” order, with the 50 being above the 200. This is called a “Golden Crossover,” which is a confirmation by some as the start of a bullish trend. Some speculators, especially momentum traders, only tend to buy assets whose moving averages are in this particular order.
Indeed it will be interesting to see if, despite some flagging signs, gold will be able to break above Friday’s range at $1280. This scenario would be very bullish in my view, which could lead to fresh follow-up technical buying towards the January 2015 high at $1307 and potentially beyond. This $1307 level also comes in just $1 below the 161.8% Fibonacci extension of the corrective move from $1263 to $1191 in mid-February, making the $1307-8 area and important target for the bulls.
But that’s a worry for another day; for now, gold needs to break above $1280 soon or otherwise a potentially sharp pullback may be on the cards.