Gold retests five year low on dwindling demand dollar strength
Gold (daily chart shown below) dropped to retest its five-year low around 1087 on Wednesday after the dramatic plunge of more than 3% that occurred […]
Gold (daily chart shown below) dropped to retest its five-year low around 1087 on Wednesday after the dramatic plunge of more than 3% that occurred […]
Gold (daily chart shown below) dropped to retest its five-year low around 1087 on Wednesday after the dramatic plunge of more than 3% that occurred during Asian trading on Monday. The rapid slide that began the trading week was the result of sudden, extreme volumes traded in China as investors dumped large quantities of gold within the span of minutes. This prompted further selling as stop-losses were executed, effectively compounding the plunge.
Tuesday saw the beginnings of a rebound to recover some of those losses, but even a partial recovery was not to be, as any early gains made were quickly pared by the end of the day. Wednesday saw further selling as investors continued to dump gold, pushing prices slightly below Monday’s trough before rebounding modestly from those lows.
Prior to this week’s selloff, gold had already broken down below its previous support level around the 1142 price region, which had served as key support in November of last year and March of this year. Last week’s breakdown confirmed a continuation of the longstanding downtrend in gold that has essentially been in place since late 2011.
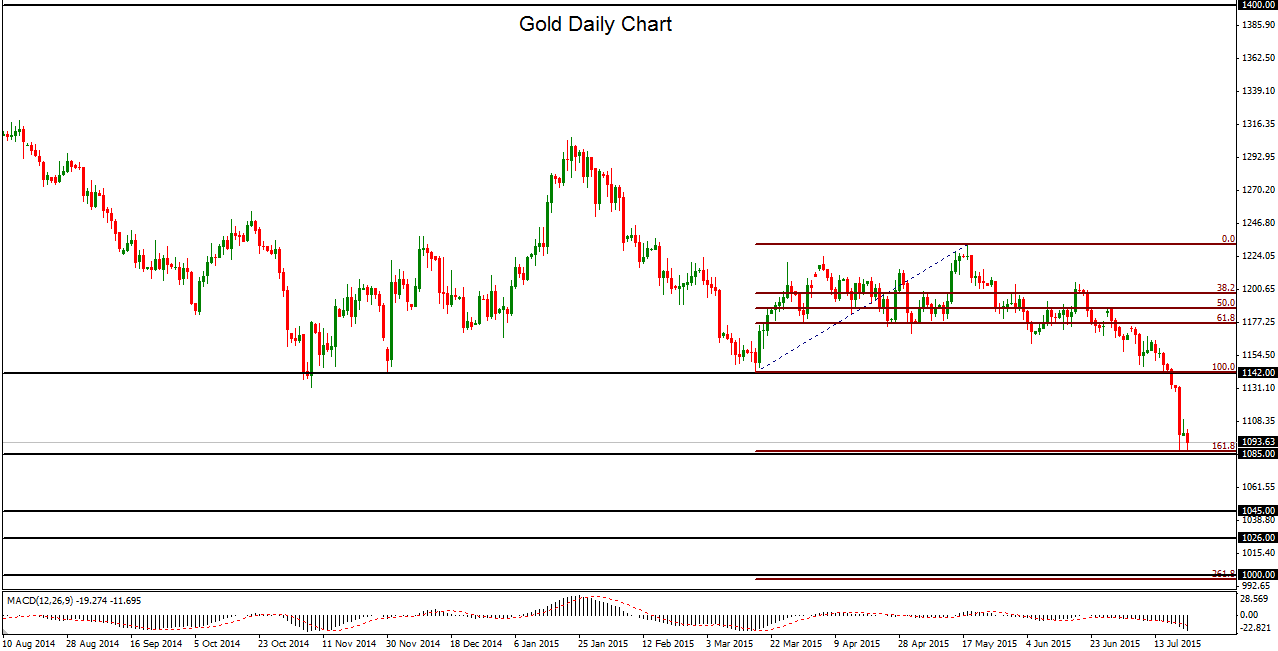
Having established and re-tested this new five-year low on Monday and Wednesday, the price of gold has closely approached a key support level around 1085 that goes all the way back to March of 2010. This level also stands as the 161.8% Fibonacci extension of gold’s latest rebound from this past March to May.
If this key support is unable to hold, a breakdown could send the price of gold tumbling down to the next major support levels at 1045 and then 1000, which is both an important psychological level as well as the 261.8% Fibonacci extension of the noted rebound earlier this year.
Any significant rebound from current support should be limited to the upside by the noted 1142 prior support level, which may now be considered a major resistance level.
