Gold rebounds off key level ahead of busy week
As we reported the possibility on Friday of last week, gold did indeed fall further lower this week. The rising dollar, yields and US equity […]
As we reported the possibility on Friday of last week, gold did indeed fall further lower this week. The rising dollar, yields and US equity […]
As we reported the possibility on Friday of last week, gold did indeed fall further lower this week. The rising dollar, yields and US equity prices all weighed on the appeal of the buck-denominated, noninterest-bearing and perceived safe-haven precious metal. Next week, as well as the much-anticipated OPEC-meeting and top-tier Chinese economic data, we will also have important macro pointers from the worlds’ largest economy, which should provide the clearest indication yet if the Fed will indeed raise interest rates come December 14. Ahead of these important events, speculators have apparently lightened up their long dollar and short gold positions, which makes sense in this shortened trading week for US investors in particular. Consequently, gold and the EUR/USD have bounced back, although both are off their best levels at the time of this writing.
While gold has reached a key technical area (see below for details), the fact that the dollar remains fundamentally supported makes us remain bearish on gold. The precious metal can of course rise in tandem with the dollar, but it will at least require stocks to fall in order to boost its safe-haven appeal. But with US stock indices at record highs, it is impossible to say when they will eventually top out. In terms of the dollar, the slight weakness we have observed at the end of this week could very well turn out to be temporary even if a December rate rise may already be priced in. Obviously we will have to wait for the Fed’s so-called dot-plots to find out the expected path of future rate rises. But if economic data continues to remain positive, which coupled with Donald Trump’s promise of fiscal spending spree next year, inflation could rise faster than the market currently expects. Thus, the Fed’s tightening cycle could be more aggressive than expected, which could help keep the dollar underpinned, especially against currencies where the central bank is still dovish and against noninterest-bearing precious metals.
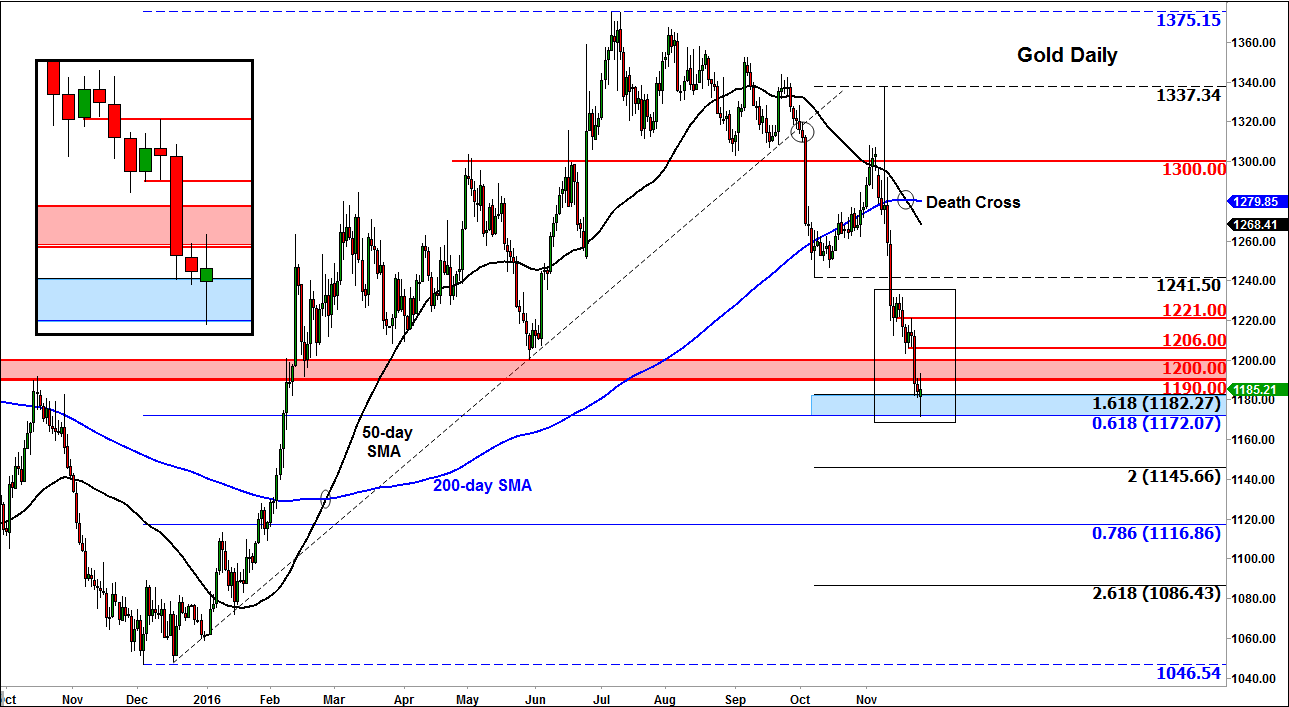
But gold has now reached our key bearish objective at $1172, so from a purely technical point of view, we are less sure about gold’s next move. As can be seen on the chart, this level corresponds with the 61.8% Fibonacci retracement against the December 2015 low. Given that large upsurge, it could be that a bottom was already made last year. Thus, the pullback here could provide another opportunity for the so-called “smart money” to reload their long positions, at a time when sentiment among the “street money” is clearly bearish. But for us to turn technically bullish on gold, we will need to see the breakdown of some key resistances now, starting with that $1190-$1200 range, which was support and resistance in the past. If and when gold starts to move above this area then we may see the breakdown of further resistance levels, for example, at $1206, $1221 or even $1241.50. However, for the long-term trend to turn decidedly bullish once again, we will need to see gold print a higher high above the most recent swing point at $1337/8 area. That is miles away from where we are at the moment. So any potential rallies in the interim should be treated with extra caution as they could very well be traps for bulls. For the bears, if support at $1172 gives way on a closing basis then they may target the other Fibonacci levels shown on the chart. In short, despite today’s bounce, gold’s path of least resistance remains to the downside for the time being.