Gold pulls back from six month high
Gold (daily chart shown below) has declined for the second day after having hit a six-month high around 1392 early in the trading week. This […]
Gold (daily chart shown below) has declined for the second day after having hit a six-month high around 1392 early in the trading week. This […]
Gold (daily chart shown below) has declined for the second day after having hit a six-month high around 1392 early in the trading week.
This high is the year-to-date culmination of a strong bullish rebound from the double-bottom, multi-year low around 1180 that was hit at the very end of 2013.
The sharp and consistent rise that has taken place since the beginning of 2014 has been virtually uninterrupted, steadily breaking out above key resistance levels and moving averages.
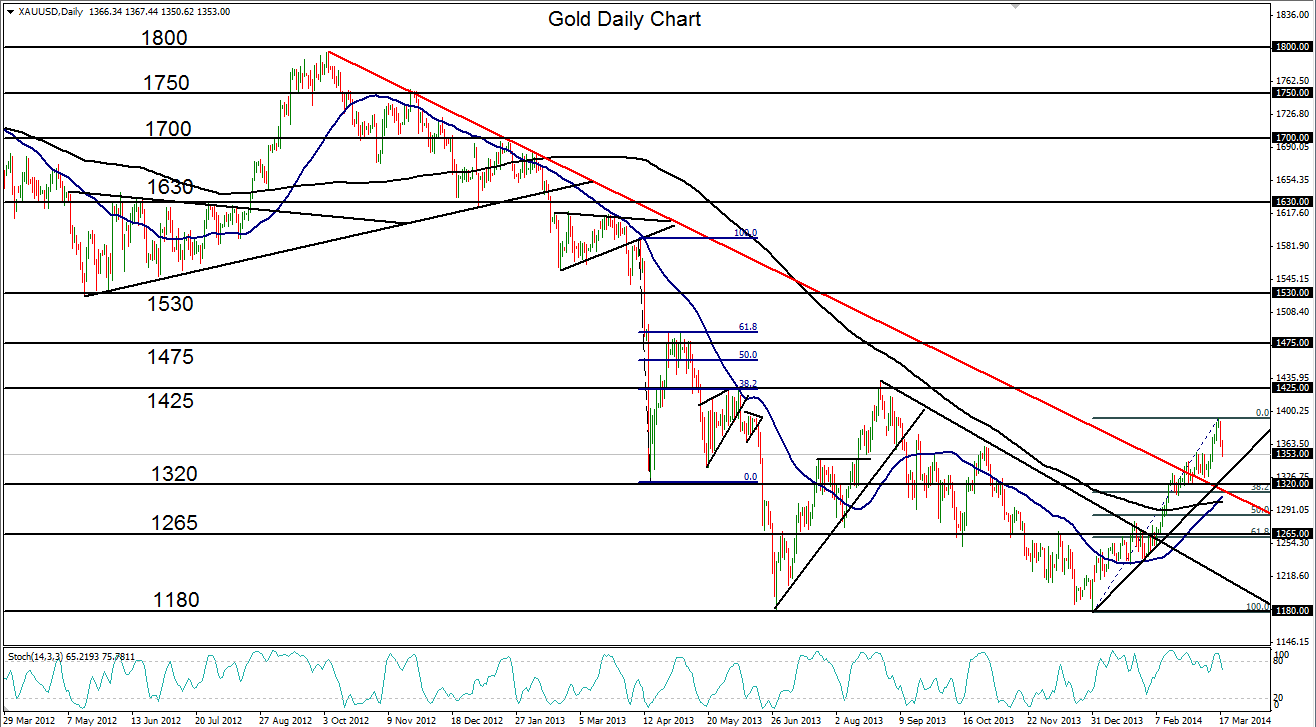
Having emerged in early March above a major downtrend resistance line that has defined the bearish trend since the October 2012 1800-area high, gold has continued to show marked bullish momentum and follow-through.
On hitting the noted 1392 high earlier in the week, a tentative moving average cross of the 50-day moving average above the 200-day moving average has occurred.
This potentially bullish indication has not been seen since 2012, and provides an additional suggestion that gold bottomed out in 2013.
In the event of a further pullback from the 1392 high, major support resides around the 1320-1325 price zone.
To the upside, a likely scenario for a resumption of the recent bullish trend would see the precious metal target key upside resistance around the 1425 level, last hit in August, which represents the peak of the noted double-bottom pattern.
