Gold poised for triangle breakdown
Gold (daily chart shown below) has continued to trade in a relative slump near the bottom of a large triangle pattern that extends back to […]
Gold (daily chart shown below) has continued to trade in a relative slump near the bottom of a large triangle pattern that extends back to […]
Gold (daily chart shown below) has continued to trade in a relative slump near the bottom of a large triangle pattern that extends back to the 1180-area multi-year low at the end of 2013 and the March 2014 high of 1392.
The current environment of low and progressively decreasing price volatility has been evident within the triangle consolidation pattern, and is accentuated by significantly flat moving averages, including both the 50-day and 200-day. Price action is currently trading slightly below both of these major moving averages.
The noted 1392 high that was hit in mid-March had provided some impetus for a potential rebound and recovery after more than a year of heavy declines in price. The past five months since that high, however, have seen a steady downside drift up to June, then only a partial rebound to early July, and finally the current consolidation.
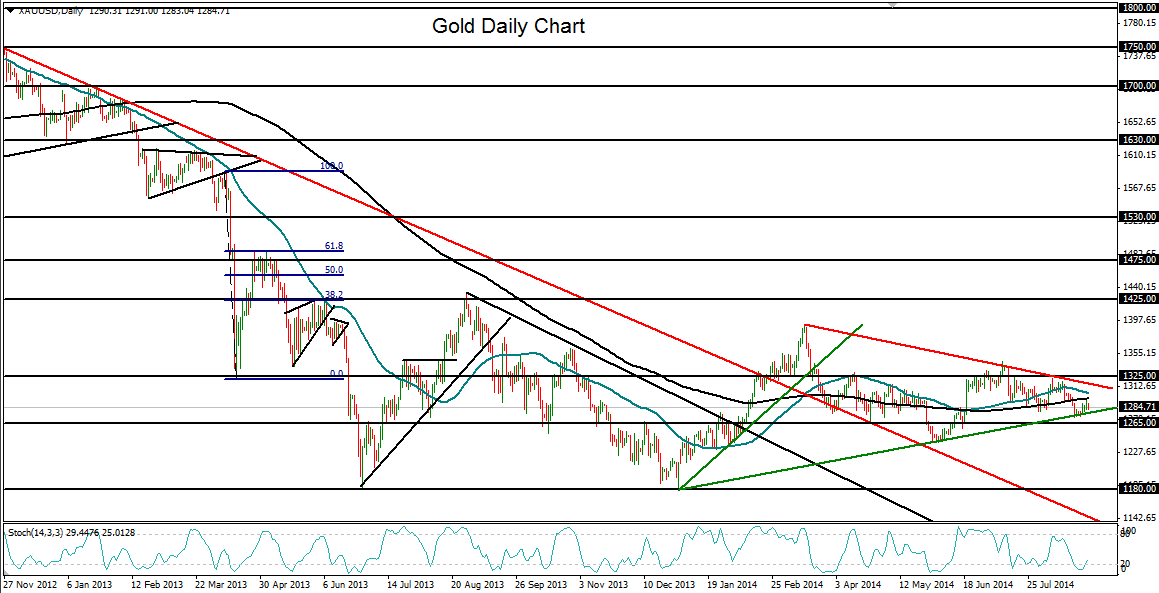
Presently weighed-down near the bottom of the triangle pattern, a breakdown below the lower border should meet immediate downside support around the 1265 level. Any trading below that support level should target a re-test of the range lows around 1240. A further break below that level could prompt a continued fall down towards major support around the 1180-area long-term lows.
To the upside, key resistance currently resides around the upper border of the triangle pattern and then the 1345 intermediate high, last reached in early July.
