Gold poised for further descent
Gold (daily chart shown below) continues to carry a substantial bearish bias after having dropped significantly in the past seven weeks to hit a 2014 […]
Gold (daily chart shown below) continues to carry a substantial bearish bias after having dropped significantly in the past seven weeks to hit a 2014 […]
Gold (daily chart shown below) continues to carry a substantial bearish bias after having dropped significantly in the past seven weeks to hit a 2014 low around 1206 late last week.
Not since the very end of 2013, when the price of gold completed a double-bottom pattern around the 1180 support level, has it declined to such an extreme low. Prior to that double-bottom formation, the last time such depths were reached was three years earlier in 2010.
Having plunged below a large triangle consolidation pattern four weeks ago, the precious metal continued its bearish momentum to drop below 1265-area support and then the 1240 level that was the most recent major low hit in June.
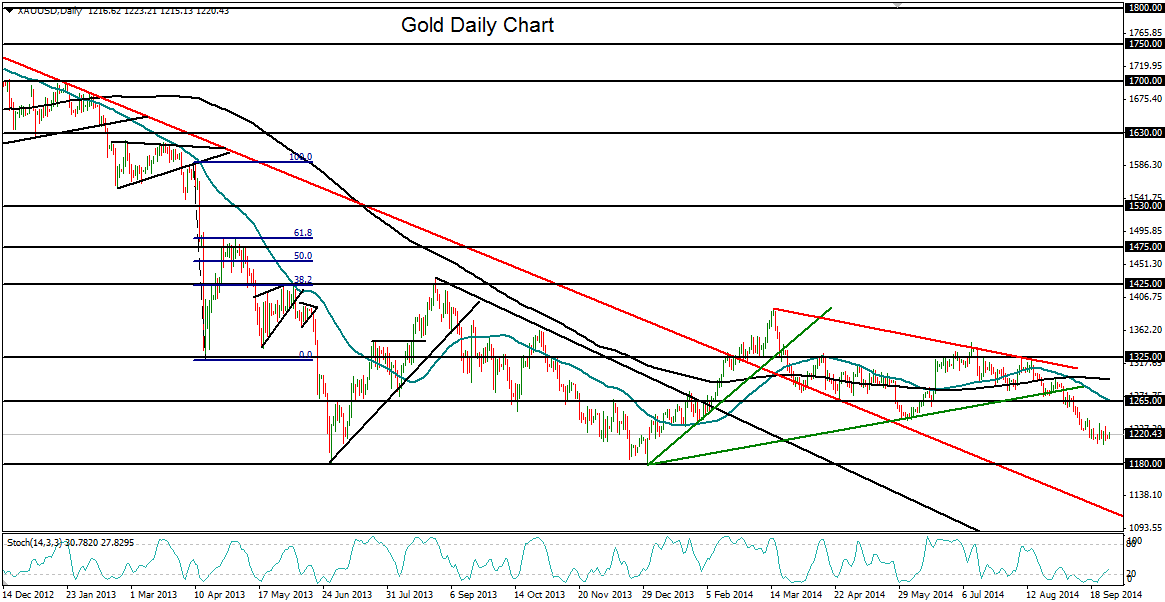
Lending to the bearish technical picture is the fact that the 50-day moving average crossed decisively below the 200-day moving average in early September, a condition that has not occurred since the beginning of 2013.
Currently consolidating its decline just above its recent lows, gold continues to show a strong bearish bias. The next clear technical target resides around the noted 1180-area double-bottom low, followed closely to the downside by the 1145 area.
Key upside resistance within the current bearish trend tentatively resides around the noted 1240 previous support level.
