Gold plunge approaching support
Gold extended its recent plunge on Monday by dropping for the fourth consecutive trading day to hit a new four-week low. In the process of […]
Gold extended its recent plunge on Monday by dropping for the fourth consecutive trading day to hit a new four-week low. In the process of […]
Gold extended its recent plunge on Monday by dropping for the fourth consecutive trading day to hit a new four-week low. In the process of this slide since last week, the price of gold has also dropped below both its 200-day and 50-day moving averages.
Helping to prompt this drop was the Fed’s statement last week that led many to speculate on a sooner US rate hike, perhaps by the end of this year. That moderately hawkish-leaning statement led to an initial surge for the US dollar and a substantial corresponding drop for gold. While the dollar quickly stabilized and gave back some of its gains, however, gold continued to fall rather precipitously.
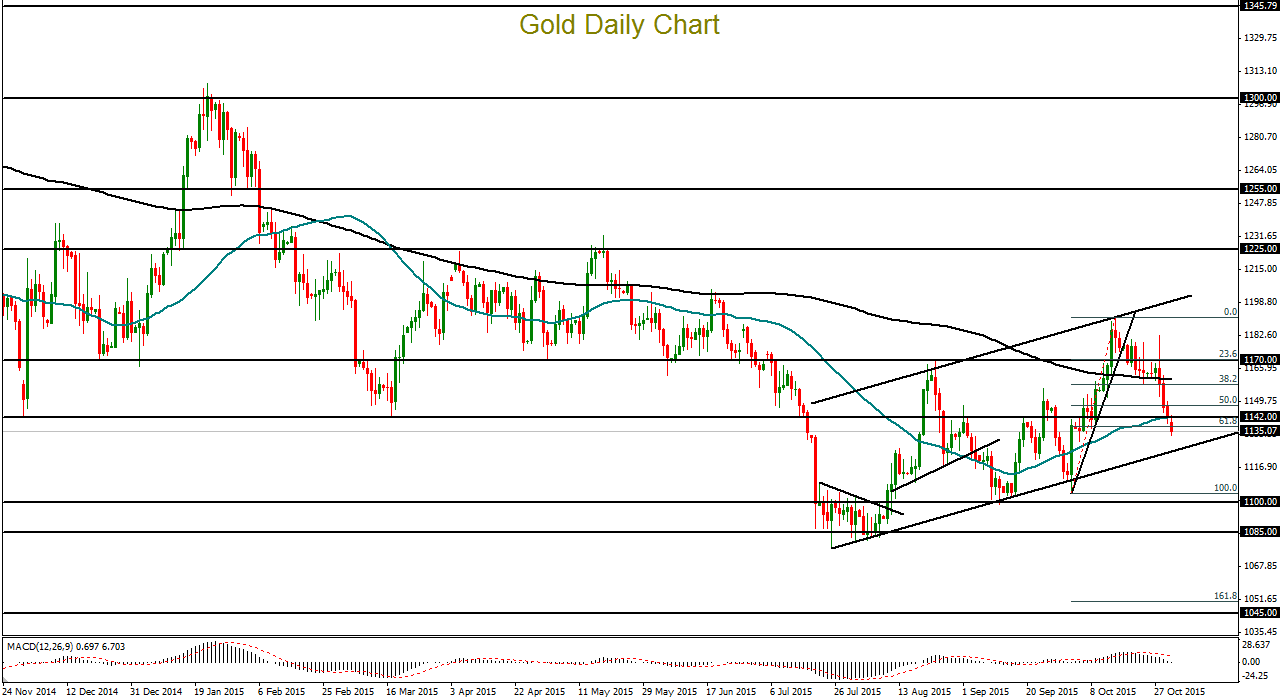
There are technical signs that the current slide could either be waning or seeking a near-term bottom, as gold is approaching the lower support border of a clearly-defined rising trend channel extending back to July’s multi-year low of $1077. Slightly more than two weeks ago, in mid-October, price action turned down from an intermediate high of $1191, which was at the upper resistance border of this same parallel trend channel. Since that high, the price of gold has plunged sharply for much of the past two weeks.
During the current trading week, perhaps the most important fundamental event that could either reinforce or reverse the bearish momentum in gold is Friday’s Non-Farm Payrolls report for October coming out of the U.S. The last four monthly employment reports fell significantly below prior expectations. If it does so again on Friday, which could affect the Fed’s decision on rate hike timing, we may expect to see a significant bounce for gold. A higher-than-expected number, in contrast, should extend the precious metal’s recent fall.
In the event of a bounce for gold, key support directly below resides around the noted bottom border of the rising trend channel. Currently, that level is roughly around the $1125 area. If there is a breakdown below that support, however, further support immediately to the downside can be found at the key $1100 level.
