Gold maintains gains into July
Gold (daily chart shown below) has managed to maintain its gains of the past month after having risen substantially from its lows around 1240 in […]
Gold (daily chart shown below) has managed to maintain its gains of the past month after having risen substantially from its lows around 1240 in […]
Gold (daily chart shown below) has managed to maintain its gains of the past month after having risen substantially from its lows around 1240 in early June.
This month-long rise has now recovered more than half of the declines in the price of gold that had occurred since the year-to-date high of 1392 was reached in mid-March.
With this partial recovery, the precious metal has shown a significant net gain from its long-term depths near 1180 at the very beginning of the year.
In the process, price action has broken out well above both the key 50-day and 200-day moving averages.
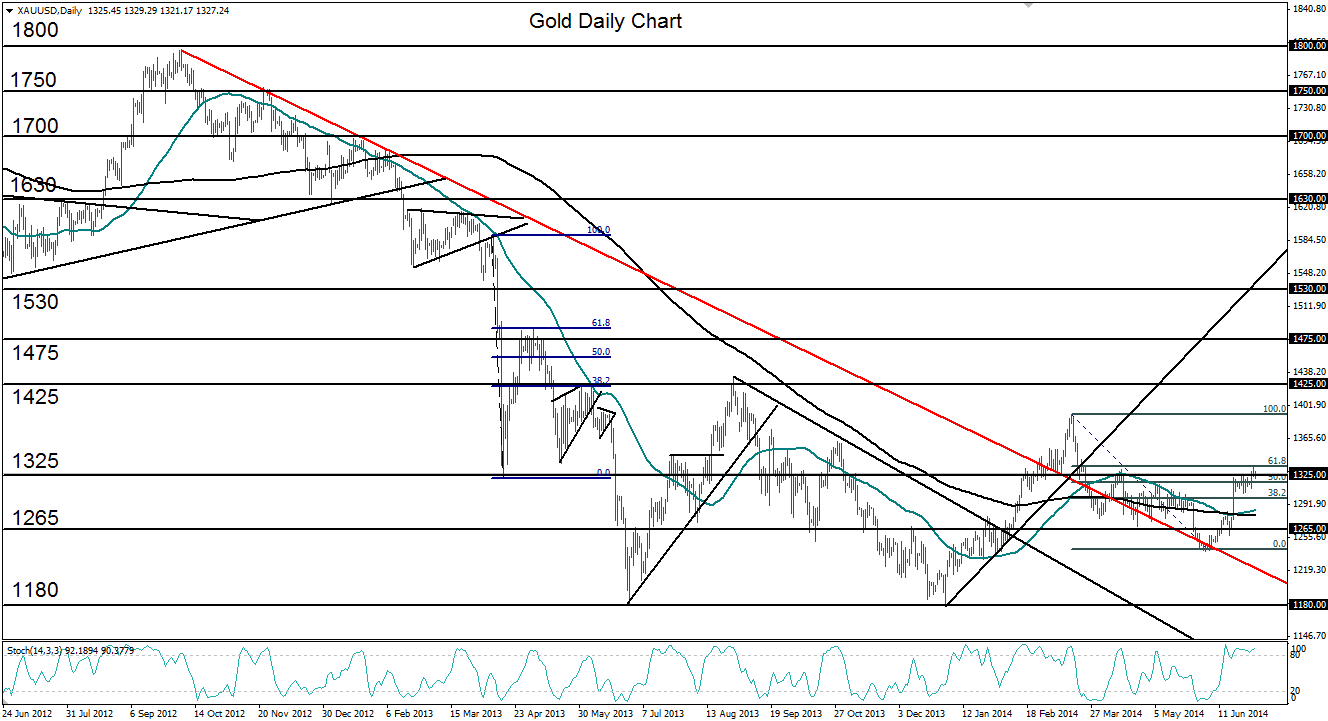
Having so far reached a new three-month high this week of 1333 (which is also around the 61.8% Fibonacci retracement of the noted decline from the March 1392 high down to the June 1240 low), gold is currently at a critical price juncture.
Now trading around the 1325 support/resistance level, the precious metal’s upside momentum could likely continue further into the month.
On any strong breakout move above the current resistance and this week’s 1333 high, the major upside targets reside around the noted 2014 high of 1392 and then 1425 resistance.
Short-term downside support on any minor pullback currently resides around 1300.
