Gold looks poised to resume rally
Safe haven gold found strong support on Thursday in response to the falling equity markets and US bond yields, with the latter helping to accelerate […]
Safe haven gold found strong support on Thursday in response to the falling equity markets and US bond yields, with the latter helping to accelerate […]
Safe haven gold found strong support on Thursday in response to the falling equity markets and US bond yields, with the latter helping to accelerate the USD/JPY sell-off. Profit-taking at the start of Friday’s session saw these assets move in the opposite direction. Gold was thus a touch weaker at the time of this writing after Thursday’s big rally. It remains to be seen whether equities and/or the US dollar will come under renewed selling pressure as we move into the North American session.
The US currency has been trending lower in recent months. Before the start of the year, the Federal Reserve had hinted at four US interest rate hikes in 2016. However, the incoming data in the first quarter of this year has been mixed at best and as a result the Fed has been quick to change its tone regarding the pace of future interest rate increases. Indeed, according to the CME Group’s FedWatch tool, the probability of even one rate rise in 2016 is now lower than 50 per cent. Meanwhile, the euro has been rising despite the European Central Bank’s decision to expand its QE stimulus package in March. This type of market reaction strongly suggests that the EUR/USD exchange rate may have bottomed out. If so, the Dollar Index could fall further, which may, in turn, help to underpin buck-denominated assets like gold and silver.
However, while the recent dollar selling in response to the Fed turning less hawkish makes sense, it may be overdone a little. US economic data could easily turn positive as a result of the recent depreciation of the dollar, while inflation could overshoot expectations if oil prices continue their sharp recovery from Q1. These potential scenarios could force the Fed to pursue a more aggressive tightening cycle, which could see the US dollar regain its composure once again. So, gold’s potential gains could be limited – that is unless the equity markets start to fall sharply once again, which would undoubtedly boost the appeal of all safe haven assets.
But in the shorter-term outlook, the volatility of the dollar will likely have a big say in gold’s direction. As such, gold traders may want to watch next week’s key data releases from the world’s largest economy closely – in particular, the PPI (on Wednesday) and CPI (on Thursday) measures of inflation. China will also be in focus once again as it publishes its latest macroeconomic data, including trade figures (Thursday), industrial production, retail sales and first quarter GDP (all on Friday). The figures will be particularly important for industrial metals, such as iron ore and copper. But silver is also used for industrial purposes. Thus, an improvement in data, if seen, may boost expectations about demand for silver. Gold demand from China has been somewhat weak this year.
Technical outlook: gold
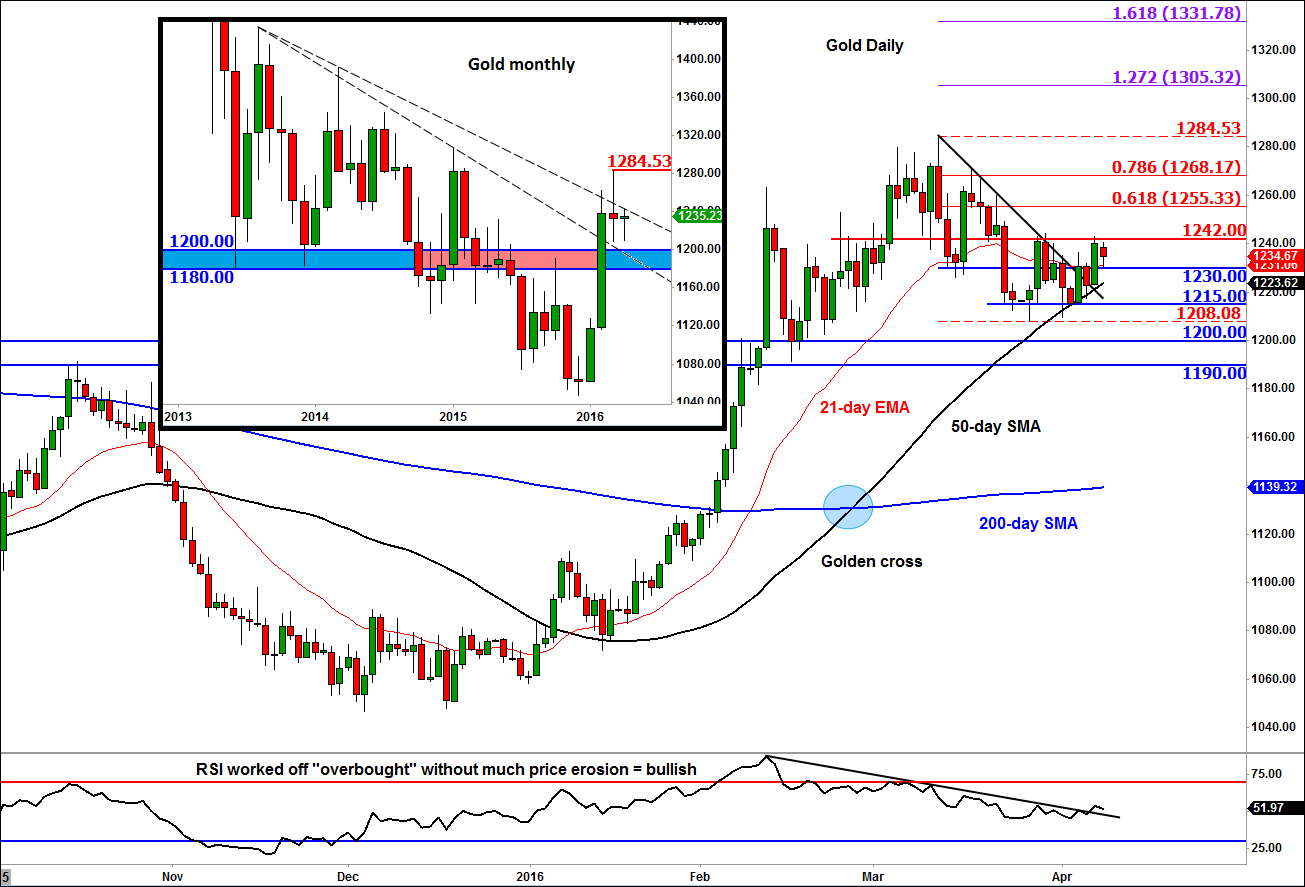
Gold looks poised to push further higher for it has now broken above a short-term corrective trend, as can be seen on the daily time chart below. Earlier in the week, the precious metal had found strong support at around the $1215/18 area, which also corresponds with the rising 50-day moving average. The 50- has recently crossed above the 200-day moving average, with the latter now also turning higher. The RSI momentum indicator has broken its own bearish trend after working off “overbought” conditions without significant price erosion. So price action is undeniably bullish inside what still is a consolidation pattern between $1200 and $1284 area.
If the precious metal goes on to break the next level of resistance at $1242, the bulls may then aim for the 61.8% Fibonacci retracement level at $1255 as their next immediate target. The rest of the Fibonacci levels, as shown on the chart, could be the subsequent bullish targets. However, a break back below the trend line and short-term support at $1215 could pave the way for a move towards the more significant support levels at $1200 or even $1190.
Meanwhile the monthly chart in the inset shows gold has cleared the long-term support and resistance area between $1180 and $1200. It has also taken out one of the two bearish trend lines. However, the rally came to a halt last month and the metal formed a doji-looking candle. So, on this time frame, it will still need to climb above the March high at $1284 in order to boost the confidence of long-term investors. While below this level, gold bugs will need to be wary of the possibility for a deeper pullback, perhaps towards the 200-day moving, before gold potentially resumes its rally.