Gold gives back 50 of 2014 gains
Gold (daily chart shown below) has given back 50% of its year-to-date gains as it’s fallen swiftly within the past two weeks from its recent […]
Gold (daily chart shown below) has given back 50% of its year-to-date gains as it’s fallen swiftly within the past two weeks from its recent […]
Gold (daily chart shown below) has given back 50% of its year-to-date gains as it’s fallen swiftly within the past two weeks from its recent high of 1392 in mid-March.
The precious metal’s advance during the first quarter of the year has been impressive, rising aggressively from a double-bottom, multi-year low around 1180 that was hit at the very end of 2013.
From that low, gold had been steadily targeting major upside resistance around the 1425 level, the double-bottom peak that was last hit in August of 2013, but fell short by turning back down at the noted 1392 mid-March high.
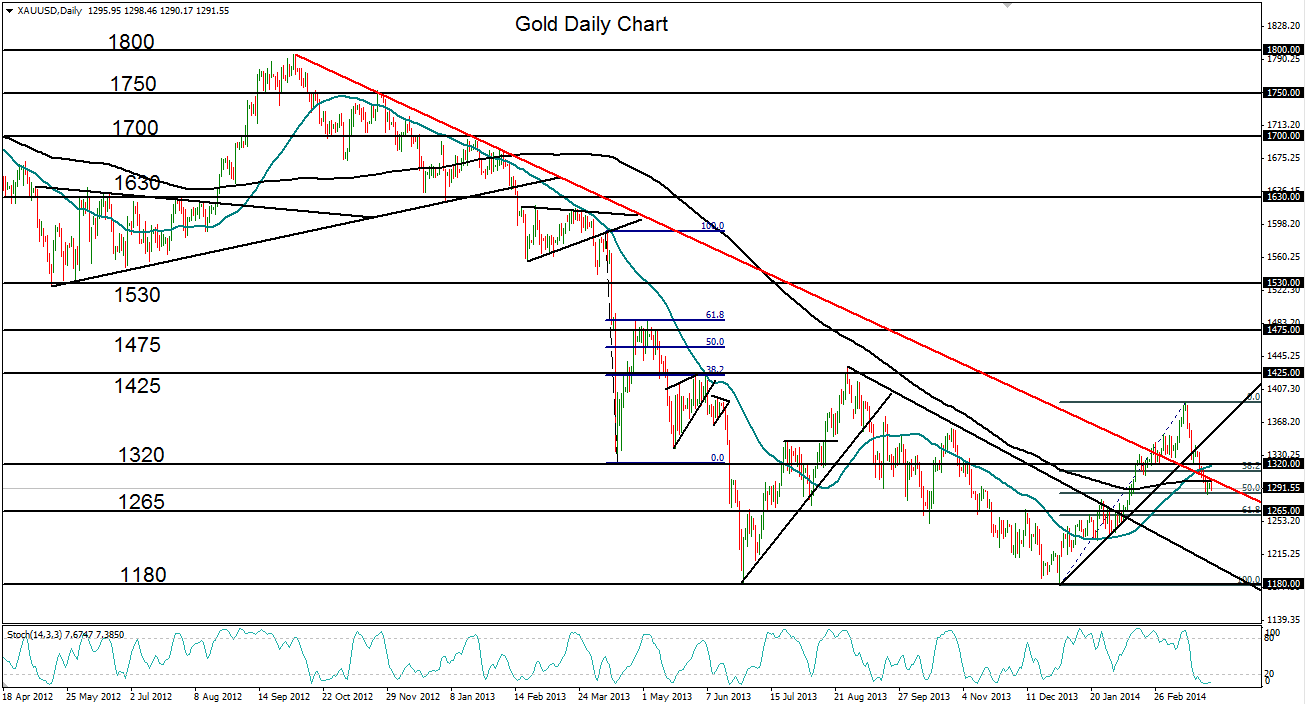
When that high was reached, the 50-day moving average made a cross above the 200-day average, a bullish indication that had not been seen since late 2012.
Having just declined substantially and begun consolidating right at its 50% Fibonacci retracement level, the price of gold has now dipped slightly below its 200-day moving average as well as a major downtrend resistance line that has defined the bearish trend since the October 2012 1800-area high.
Any further pullback should meet key support around the 1265 level, which is also around the 61.8% Fibonacci level.
To the upside, an eventual resumption of the recovery in gold should continue to target major upside resistance at the noted 1425 level.
