Gold finally round ing into form
Everyone’s favorite precious metal has fallen a long way from the halcyon days of a few years ago, when it seemed like gold could do […]
Everyone’s favorite precious metal has fallen a long way from the halcyon days of a few years ago, when it seemed like gold could do […]
Everyone’s favorite precious metal has fallen a long way from the halcyon days of a few years ago, when it seemed like gold could do no wrong. Nowadays, traders are more likely to get laughed at then applauded for buying gold, and based on the trend over the last few years, skepticism toward long gold positions is certainly warranted.
As is often the case with markets though, the sentiment may finally have swung too far in the other direction, at least on a short-term basis. Gold has been a big beneficiary of the market turmoil so far this year, as scared traders rushed to the traditional safe haven metal and central banks (prominently including the Fed, RBNZ, and BOJ just this week alone) shift to more dovish, loose money postures.
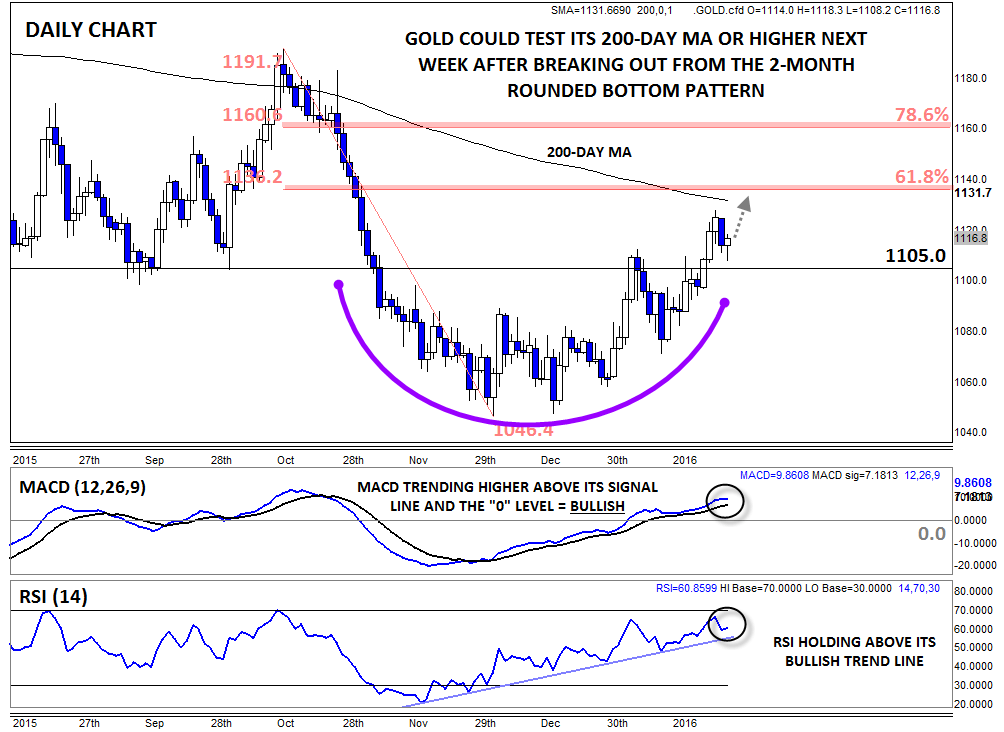
Over the last two months, gold has actually carved out a clear rounded bottom pattern in the mid-1000s. According to our friends at Investopedia.com, Rounded bottoms “are found at the end of extended downward trends and signify a reversal in long-term price movements. This pattern’s time frame can vary from several weeks to several months and is deemed by many traders as a rare occurrence.” While we still feel that it’s premature to call a long-term reversal in gold, the pattern certainly suggests that we could see more strength in gold over the next few weeks.
The secondary indicators bolster the case for further gains in gold. The MACD indicator turned higher back in November and is still trending comfortably upward above both its signal line and the “0” level. Meanwhile, the RSI indicator is following its own bullish trend line higher; both of these developments show strong and growing bullish momentum.
Moving forward, the short-term bias in gold points higher as long as the yellow metal remains above the key 1100-1110 zone. To the topside, the key levels to watch in the coming week will be the 200-day MA at 1130, followed by the 61.8% and 78.6% Fibonacci retracements of the Oct-Nov drop at 1135 and 1160, respectively.