Gold falls out favour as equities surge
Safe haven gold has been falling out of favour since the start of this week. Investors have apparently been piling into equities, especially in the US where the S&P 500 has climbed to a new all-time high .
Safe haven gold has been falling out of favour since the start of this week. Investors have apparently been piling into equities, especially in the US where the S&P 500 has climbed to a new all-time high .
Safe haven gold has been falling out of favour since the start of this week. Investors have apparently been piling into equities, especially in the US where the S&P 500 climbed to a new all-time high on Monday and the index future points to a new record high open this afternoon. Added to this, the dollar has managed to hold onto most of the gains made post Brexit due to a slight improvement in economic data in the US, and speculation over a BOJ easing which has lifted the USD/JPY to a high so far of 104.00 today. But ETF investors continue to pile in on gold, possibly due to the lingering worries about the economic consequences of Brexit and the health of Italian banks. This week’s price slide may therefore be based on profit taking from speculative financial investors.
Indeed, according to positioning data from the CFTC, money managers and other financial speculators had further expanded their net long positions to a new record high in the week to 5 July. In the prior five weeks alone, bullish bets have risen by nearly 85 per cent. Clearly this means that the potential for profit-taking is very high now – and not just for gold. Silver’s net long positions likewise reached a new record high level last week of nearly 81 thousand contracts. Added to this, gold has reached a significant area of technical resistance, as discussed below.
Technical outlook
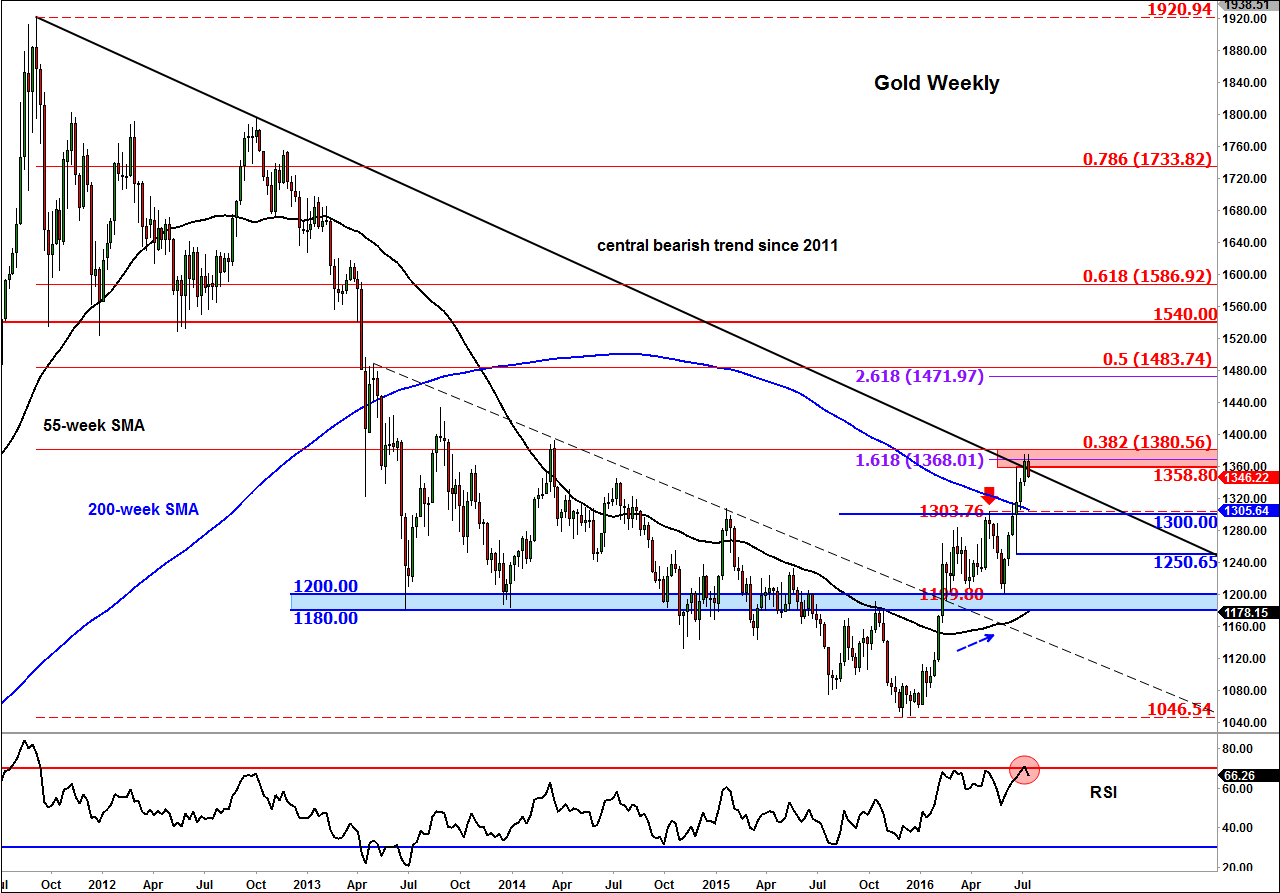
After climbing for five consecutive weeks, gold has now reached a potentially strong resistance area around $1358-$1380. As can be seen from the weekly chart, below, this is where the central bearish trend line that has been place since the year 2011 meets a couple of Fibonacci levels: the 38.2% retracement against that 2011 all-time high and the 161.8% extension of the most recent downswing. Unsurprisingly, the momentum indicator RSI has reached the “overbought” threshold of 70 on the weekly and daily time frames. The RSI probably needs time to unwind now, but it essentially shows strength.
Given the above technical considerations, a pullback of some sort would not come as a surprise to me whatsoever. In fact, this could be a healthy outcome as far as the bullish argument is concerned as it will allow the oscillators to unwind from overbought levels, providing opportunity for new buyers to step in at better levels. If gold consolidates near these highs and the RSI unwinds through time rather than price action then this would point to further sharp gains at some point down the line. The potential levels of support that will need to hold are shown on the chart in blue, the most important one in my view being $1300 (the meeting point of old support with the 200-week moving average).
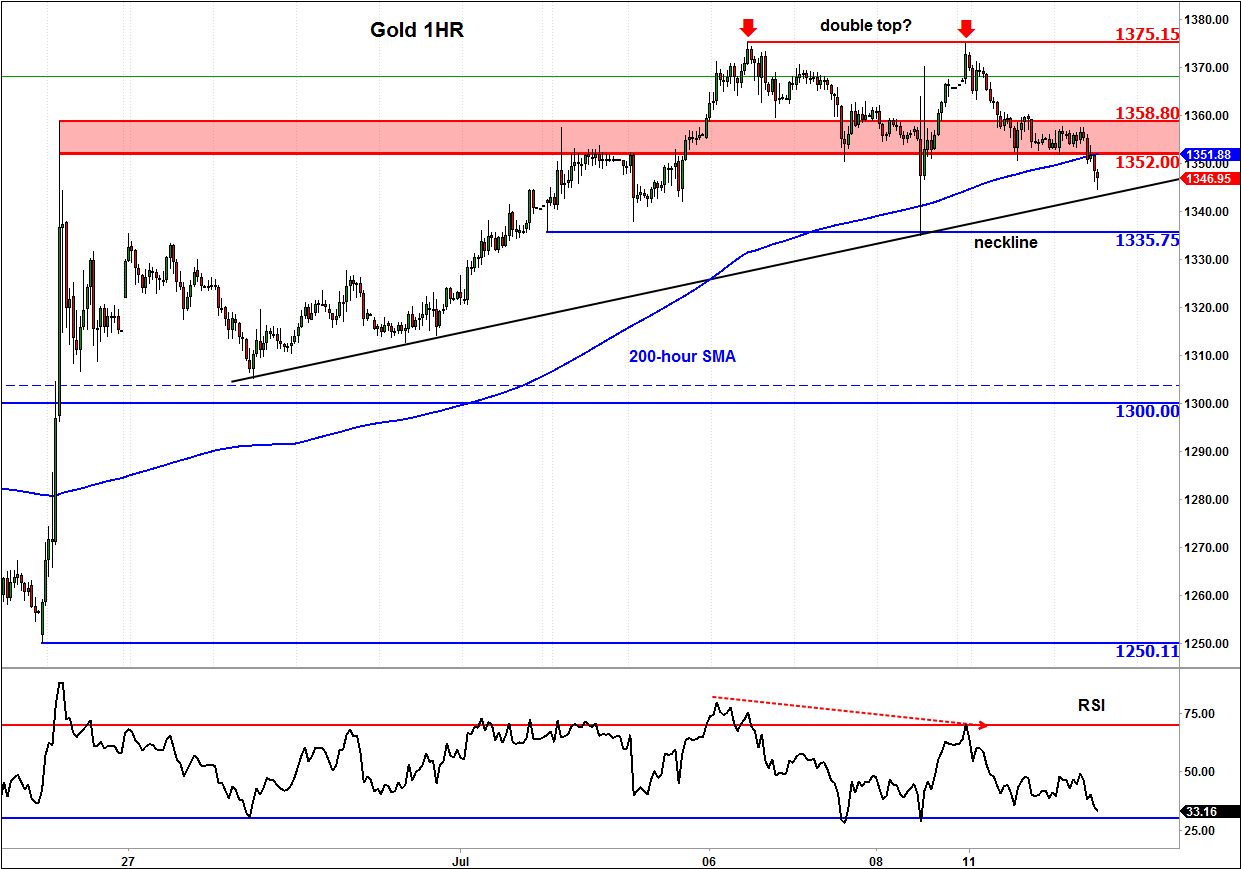
Meanwhile on the much shorter 1 hour chart, gold may have formed a double top formation at $1375. The precious metal has already broken short-term support at the $1352/58 area and has moved below the 200-hour moving average for the first time since June 21. The neckline of the H&S pattern comes into play at $1335/6 area. A decisive break below here could see gold drop all the way to key support at $1300 next. Bullish traders meanwhile may step back in if there is a false breakdown scenario here or if we see the formation of some other bullish patterns. In any case, they will need to be patient now as price could ease further in the short term outlook.