Gold extends tight trading range near multi year lows
Gold (daily chart shown below) has continued to trade in a tight trading range after pulling back sharply from its 1392 high of mid-March. This […]
Gold (daily chart shown below) has continued to trade in a tight trading range after pulling back sharply from its 1392 high of mid-March. This […]
Gold (daily chart shown below) has continued to trade in a tight trading range after pulling back sharply from its 1392 high of mid-March.
This trading range has fluctuated around halfway between the 1180-area multi-year low at the end of 2013 and the noted March 1392 high.
Gold’s rise for the first three-and-a-half months of the year had shown promising signs of a bona fide recovery after the long drop from 1800 in October 2012 and then the large double-bottoming pattern around 1180.
The recovery began to fizzle, however, when gold pulled back sharply in March and subsequently entered the current trading range.
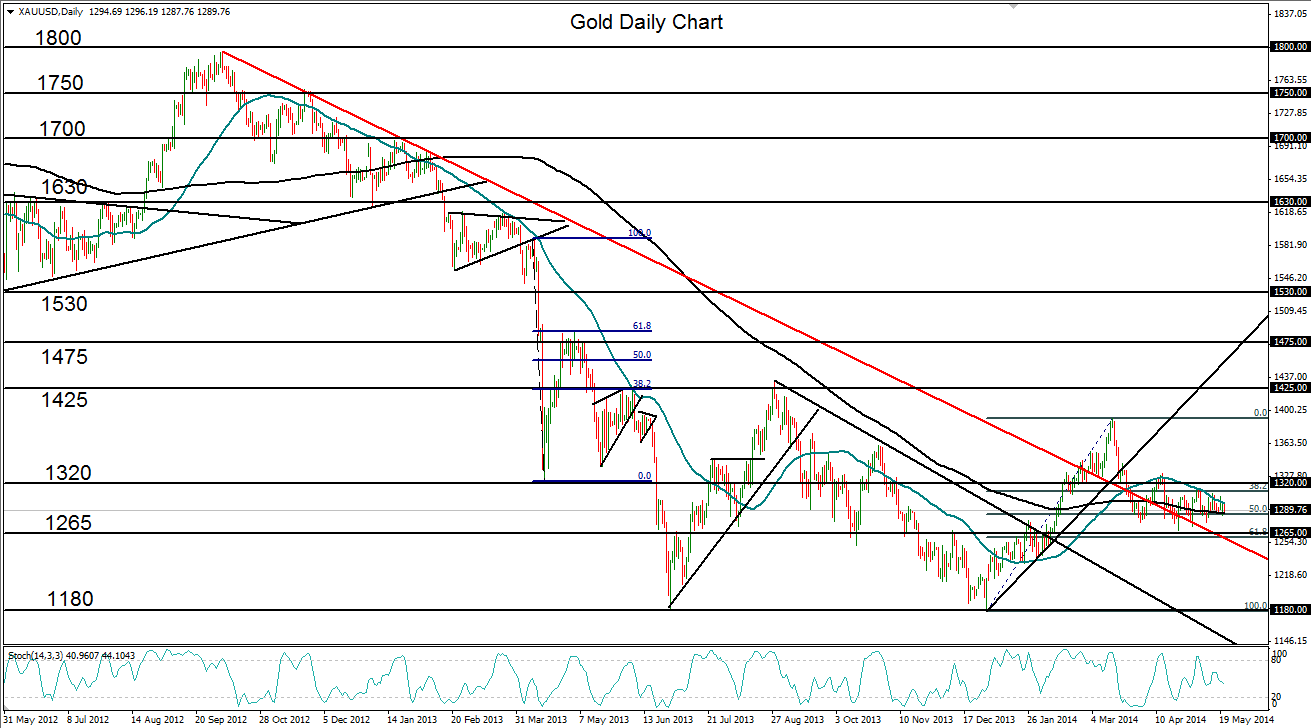
When the March high of 1392 was reached, the 50-day moving average had made a conspicuous cross above the 200-day moving average, a bullish indication that had not been seen since late 2012. This bullish indicator also fell short, however, when price action began its prolonged consolidation in April.
Currently, the major resistance area to watch remains at the 1320-1330 price zone. A breakout above that area could put gold back on the recovery track, with a major upside target around the 1425 resistance level.
Alternatively, any breakdown below the key 1265 support level could return the precious metal back down towards a retest of multi-year depths once again.
