Gold Extends Decline to Three Month Low
Gold (daily chart) has extended its decline slightly below key support around the 1265 level, establishing a new three-month low in the process. In doing […]
Gold (daily chart) has extended its decline slightly below key support around the 1265 level, establishing a new three-month low in the process. In doing […]
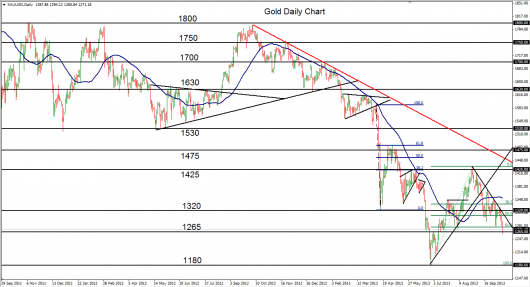
Gold (daily chart) has extended its decline slightly below key support around the 1265 level, establishing a new three-month low in the process. In doing so, the precious metal has also fallen below the 61.8% Fibonacci retracement of the rebound from the June 1180 multi-year low up to the August 1433 high. The continued decline that has been in place for the past month and a half has followed a well-formed downtrend line that outlines a strong potential for gold to continue the overall bearish trend that has been in place since the October 2012 highs near 1800.
The bullish rebound that occurred in July and August took a sharp turn to the downside after hitting the noted 1433 high in late August, and then continued down to form bearish head-and-shoulders reversal patterns of varying sizes. Having just reached down to the 1265 support area, a strong breakdown below this area should target the major downside objective around the noted 1180 low, last hit in June. A further breakdown below 1180 would confirm a continuation of the long-term bearish trend in gold.