Gold drops sharply towards major support
Gold (daily chart shown below) has been dropping sharply within the past week, potentially on its way back down towards major support around the 1180 […]
Gold (daily chart shown below) has been dropping sharply within the past week, potentially on its way back down towards major support around the 1180 […]
Gold (daily chart shown below) has been dropping sharply within the past week, potentially on its way back down towards major support around the 1180 level.
This 1180 level has held strongly as support since it was first tested in June of 2013. Since that time, the level has been re-tested and respected two more times – at the very end of 2013 and recently in early October – forming a potential triple bottom pattern.
After rising from the third support test in early October, gold hit a high last week of 1255, just short of its 1265 target, before dropping sharply.
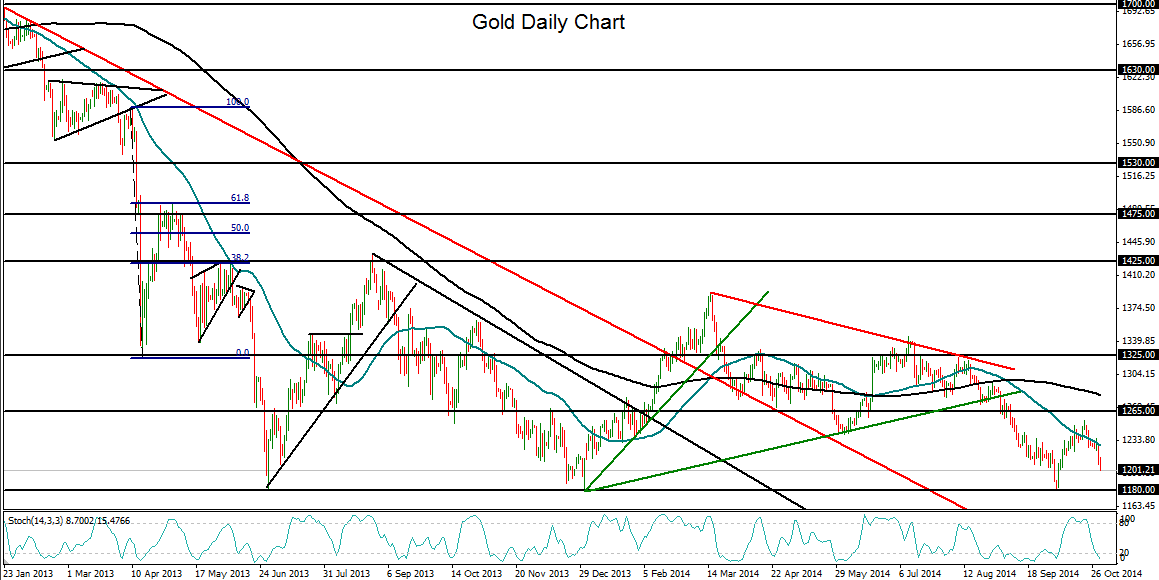
Wednesday’s FOMC statement significantly exacerbated the precious metal’s decline, placing it on a potential path towards 1180 once again.
Gold remains entrenched within a long-term downtrend extending back at least two years to October of 2012. In the event of a breakdown below key 1180 support, which would further extend the long-term bearish trend, the 1100 area is the next major support target to the downside.
In the event of any rebound at or above the 1180 level, the 1255-1265 area should continue to serve as major resistance to the upside.
