Gold death cross amp post FOMC sell off
Gold enters a second losing week after having risen more than 17% to hit 6-month highs on March 17. The fundamentals of the recent gold […]
Gold enters a second losing week after having risen more than 17% to hit 6-month highs on March 17. The fundamentals of the recent gold […]
Gold enters a second losing week after having risen more than 17% to hit 6-month highs on March 17. The fundamentals of the recent gold rise may not be as clear as the fundamentals to last year’s sell-off, but central bank buying near the 1180s lows and escalating uncertainties on the Russia-Ukraine standoff have been the most frequently-cited factors.
We look at the drivers of the recent rally before assessing price prospects into Q2.
Aside from central banks, speculators have also sought to snap up the yellow metal in December, as net speculative longs in the Chicago Mercantile Exchange’s Comex soared 430% to 137,000 contracts into mid-March. India’s easing of gold import duties earlier in the year has also helped regenerate retail interest.
Also in January, the IMF raised its forecasts for 2014 global growth, including GDPs for the US, Japan, UK and China. The abating of disinflationary fears in the US in early Q1 was also seen as a positive for the US (before inflation figures began slowing in the US recently).
Last week’s more hawkish than expected FOMC projections regarding the timing of the next fed funds rate hike served to accelerate gold’s decline, on the premise that higher bond yields and, ultimately an increase in the benchmark overnight rate would erode gold’s return. The Fed’s Wednesday announcement triggered the biggest daily yield gain since November, pushing 10-year yields to 2.79%.
Anticipating further yields’ gains and gold selling into Q2 on the basis of hawkish Fed rhetoric would only be validated by a notable improvement in momentum of US data, which must extend beyond post-weather normalization. As long as bond traders have not seen a close above 2.82% in US 10-year yields, we’re unlikely to see a gold break below $1,270.
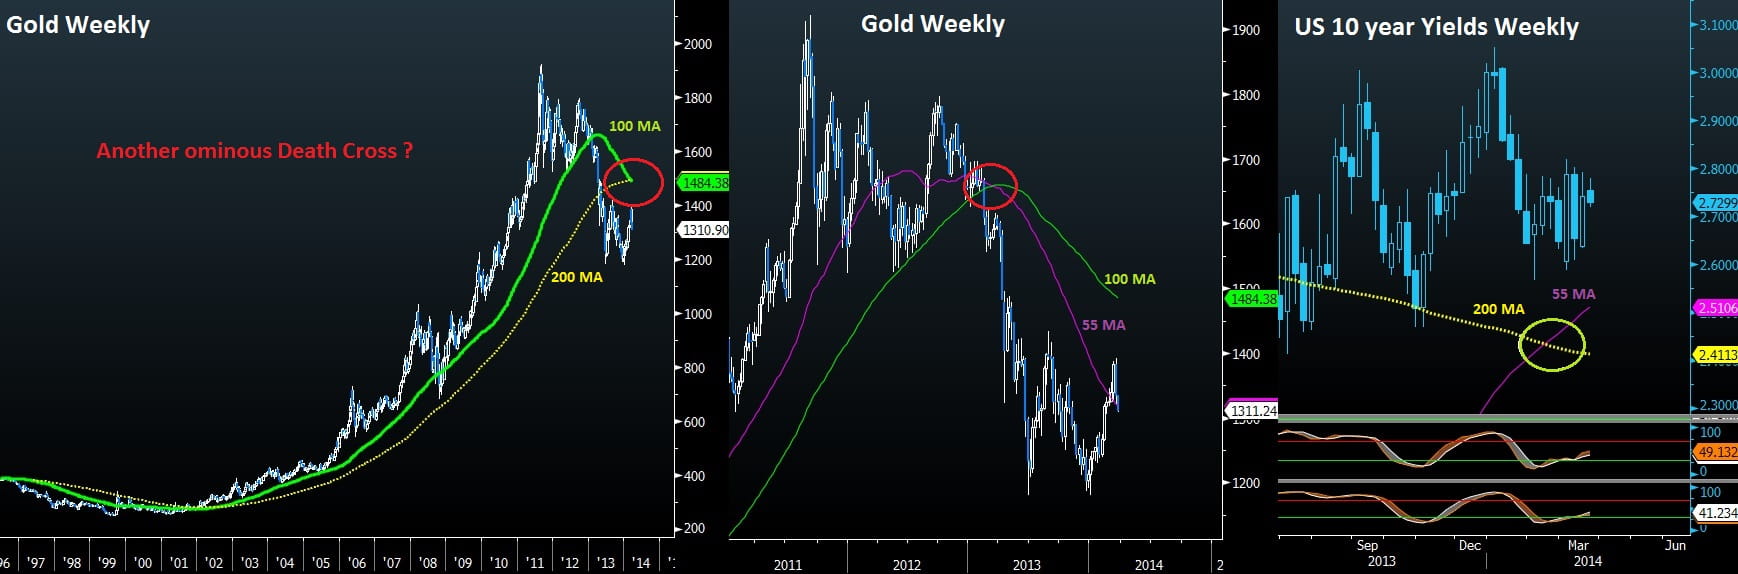
There has been a high profile bearish technical development in the price of gold, namely, a “death cross” formation, as indicated by a decline in the 100-week moving average below the 200-week moving average—for the first time since 2002. Care must be paid when drawing conclusions from “death” and “golden crosses” due to the time lag involved. Just as gold broke above its 55-week moving average, it failed to add to its advances, falling well short of the next key resistance at $1,484—confluence of the 100 and 200-week moving averages. Gold’s near term prospects are seen revisiting $1,295, a break of which will risk a trigger of stops towards the $1,270-3.
The fundamental red-flags seen in triggering a renewed gold collapse beyond $1,250 would be a re-emergence of disinflationary risks (note the recent slowdown in Eurozone, US and CPI), a transition in Chinese deflation from producer to retail level and a clear abatement of the geopolitical tensions in Russia/Ukraine. Only these factors are seen as the most credible dynamics accelerating the decline of the metal.