Gold continues to show further weakening
Gold (daily chart shown below) has continued to decline in correlation with the US dollar’s recent marked strength. The precious metal has just hit a […]
Gold (daily chart shown below) has continued to decline in correlation with the US dollar’s recent marked strength. The precious metal has just hit a […]
Gold (daily chart shown below) has continued to decline in correlation with the US dollar’s recent marked strength. The precious metal has just hit a new seven-month low and continues to show signs of further weakening.
After breaking down below a large triangle consolidation pattern early last week, the price of gold continued its bearish momentum to plunge below 1265-area support and now tentatively below the 1240 level that was the most recent major low hit in June.
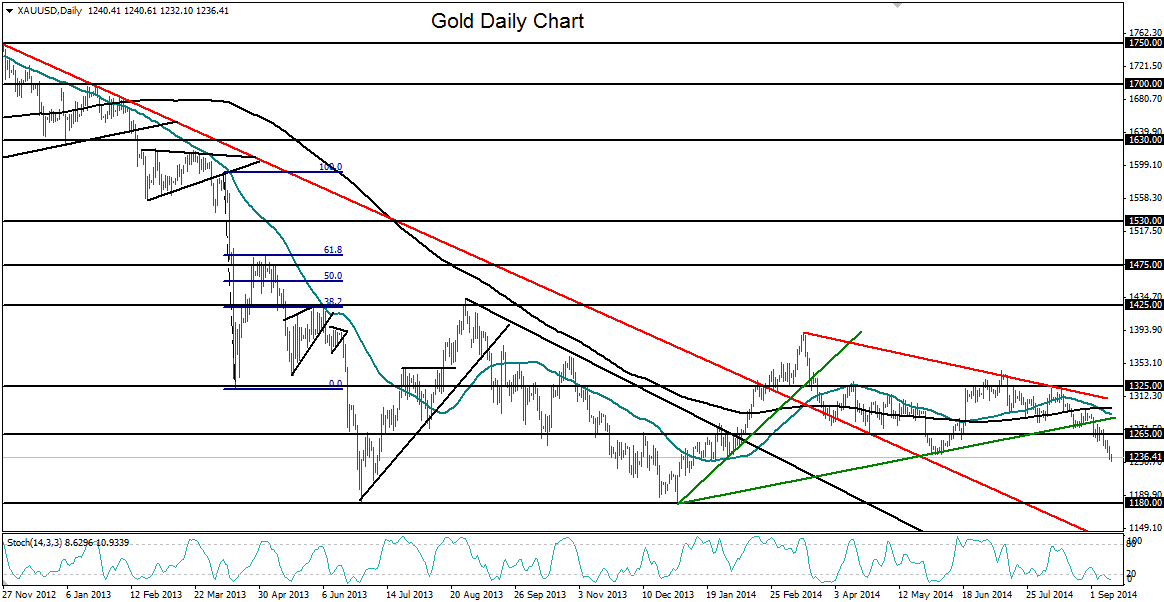
Lending to the bearish technical picture is the fact that the 50-day moving average has just crossed below the 200-day moving average, a condition that has not occurred since early 2013.
Having declined steadily for the past month from a mid-August high around 1320 down to its current position in the mid-to-low 1200’s, gold’s prospects continue to appear dim.
The major downside target for the precious metal continues to reside around the 1180 double-bottom low, which was last hit at the very end of last year. Key upside resistance within the current bearish trend now resides around the noted 1265 area.
