Gold consolidates within attempted recovery
Gold (daily chart) has stalled within a tight flag-like consolidation after rising modestly in the past three weeks from depths as low as 1180 in […]
Gold (daily chart) has stalled within a tight flag-like consolidation after rising modestly in the past three weeks from depths as low as 1180 in […]
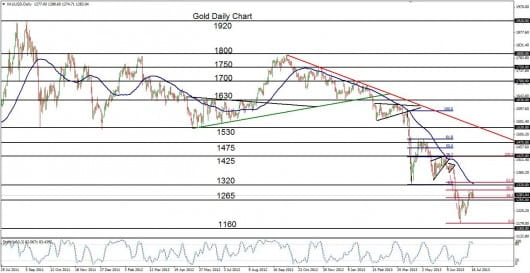
Gold (daily chart) has stalled within a tight flag-like consolidation after rising modestly in the past three weeks from depths as low as 1180 in late June. That trough represented almost a three-year low for the precious metal, closely approaching a support level of around 1160 that was last hit in mid-2010. The attempted recovery of the past three weeks has thus far brought the price back up to around the 50% Fibonacci Retracement of the plunge from around the important 1425 resistance level down to the noted 1180 long-term low. In the process, the price has recovered above the key 1265 support/resistance level.
Having just formed a small flag consolidation pattern, gold would need to breakout significantly above the high of this pattern around the 1300 level if it is to confirm a continuation of the current upside correction and recovery. In this event, a key intermediate price objective to the upside resides around the noted 1425 level. Any strong breakdown below current support around the 1265 level could likely invalidate or delay the recovery.