Gold consolidates after sharp declines
Gold (daily chart shown below) has begun a consolidation after having declined sharply for almost a month. The most recent declines began after the precious […]
Gold (daily chart shown below) has begun a consolidation after having declined sharply for almost a month. The most recent declines began after the precious […]
Gold (daily chart shown below) has begun a consolidation after having declined sharply for almost a month. The most recent declines began after the precious metal hit a five-month high around 1307 in late January.
Subsequent to reaching that high, price action began a plunge that erased around 7% of gold’s value by mid-week of last week, hitting a low around 1216.
That plunge dipped below both the 200-day and 50-day moving averages to hit the upper border of a large triangle consolidation pattern that gold had broken out of in early January.
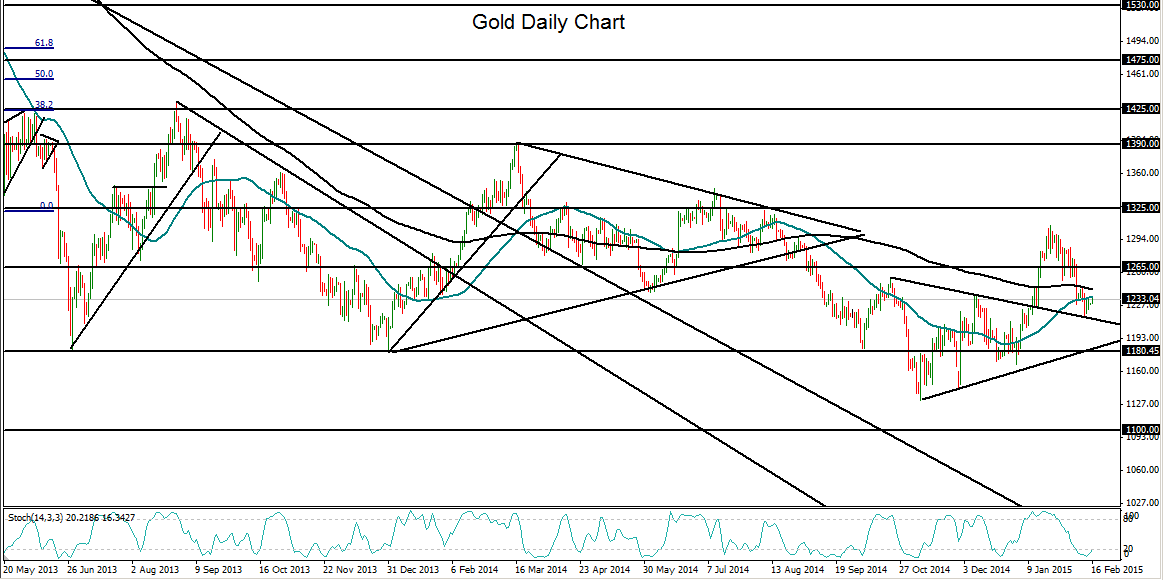
After hitting that low, there has been a modest rebound off the support of the triangle pattern’s border.
Despite the recent plunge and the fact that gold has been entrenched in a long-term downtrend for several years, November’s rebound from the 1130-area multi-year low provided an indication of a potential bottoming out. This bottoming thesis was reinforced by the noted breakout above the triangle pattern in January.
Last week’s modest rebound from support and the current consolidation could be an indication that a recovery may still be in play. If price action is able to stay above the triangle pattern support and rise above the two noted moving averages, the major upside targets continue to reside around the 1265, 1300, and 1345 resistance levels.
