Gold breaks down towards multi year lows
Gold (daily chart shown below) has broken down below key support, potentially on its way back down towards the three-year low of 1178 that was […]
Gold (daily chart shown below) has broken down below key support, potentially on its way back down towards the three-year low of 1178 that was […]
Gold (daily chart shown below) has broken down below key support, potentially on its way back down towards the three-year low of 1178 that was hit at the very end of 2013.
For the past two months, gold has fluctuated within a tight trading range around its 50-day and 200-day moving averages. This trading range occurred after the precious metal had shown a promising rise and potential recovery from its noted 1180-area multi-year low up to a high of 1392 in March.
After that high was reached, however, gold quickly gave back around half of its gains before it began fluctuating within the noted trading range.
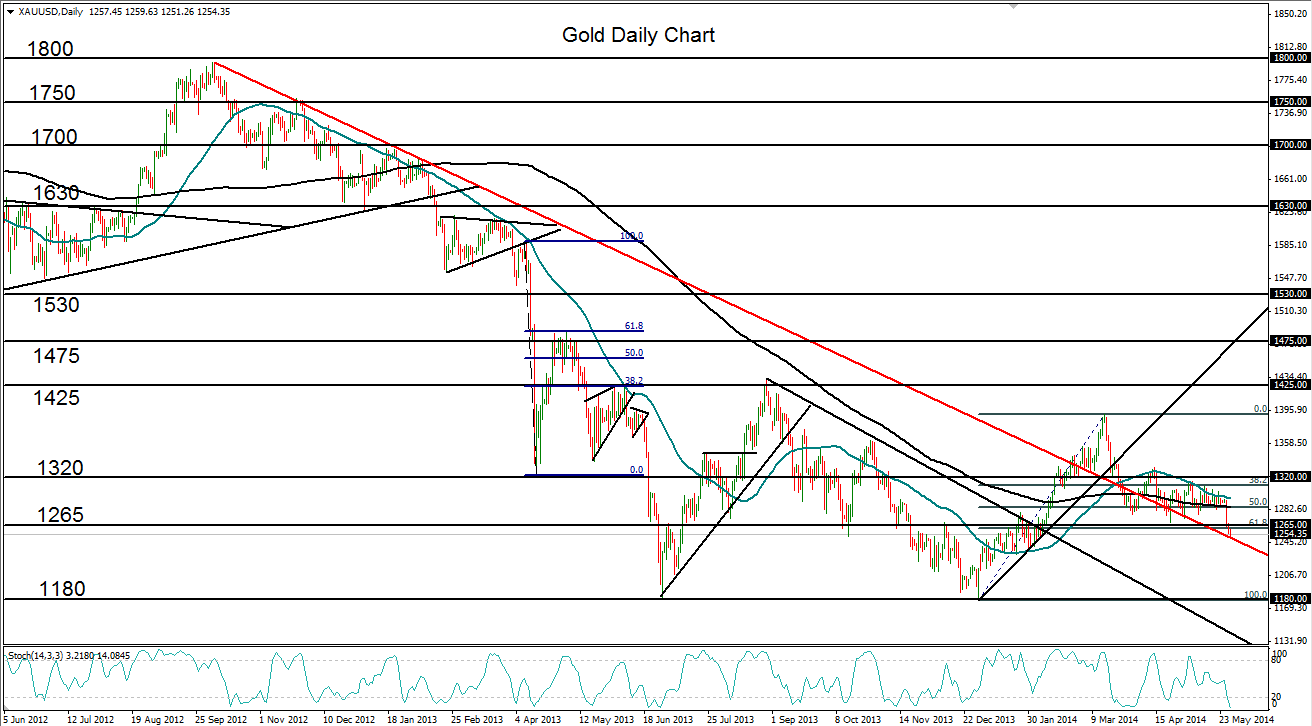
Currently, bearish price action that began earlier in the week has prompted a tentative breakdown below key support at the 1265 level, which was also around the lower border of the trading range.
There has also been a concurrent breakdown below the key 61.8% Fibonacci retracement of the rise from 1178 up to 1392.
If the price of gold stays below the 1265 level, which may now begin to act as resistance after the support breakdown, there could be a return back down towards a third test of the 1180-area double bottom lows.
