Gold bounces from seven week low
Gold (daily chart shown below) has declined sharply for more than a month from its late January high around 1307. Since that high, the precious […]
Gold (daily chart shown below) has declined sharply for more than a month from its late January high around 1307. Since that high, the precious […]
Gold (daily chart shown below) has declined sharply for more than a month from its late January high around 1307. Since that high, the precious metal has fallen by around 9% to this week’s low of 1190.
In the process of this decline, the price of gold has plunged swiftly below the key 1240 level, as well as both the 200-day and 50-day moving averages. It has also broken back down into a large triangle consolidation pattern that it had broken out of in early January.
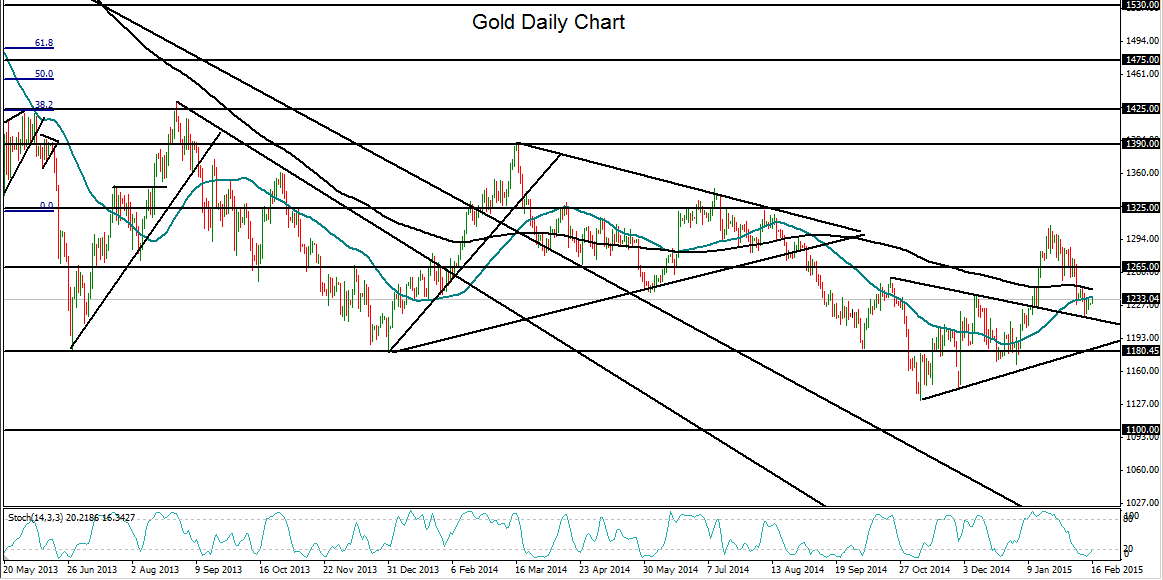
Having fallen to a seven-week low earlier in the week, gold has rebounded slightly back above the 1200 level. With major downside support residing around the 1180 level, the current price area could serve as a tentative bottoming stage for the precious metal.
If the price of gold is able to stay above 1180 support, a significant rebound could push price back up to resistance targets at 1240, 1265, and 1300 – above the noted moving averages.
Any breakdown below 1180 support could once again prompt a return to re-test November’s 1130-area multi-year low.
