Gold bears lurking as price approaches major resistances
Last week gold managed to post its first gain in eight weeks. Prices were supported almost entirely by a slightly weaker US dollar and momentum […]
Last week gold managed to post its first gain in eight weeks. Prices were supported almost entirely by a slightly weaker US dollar and momentum […]
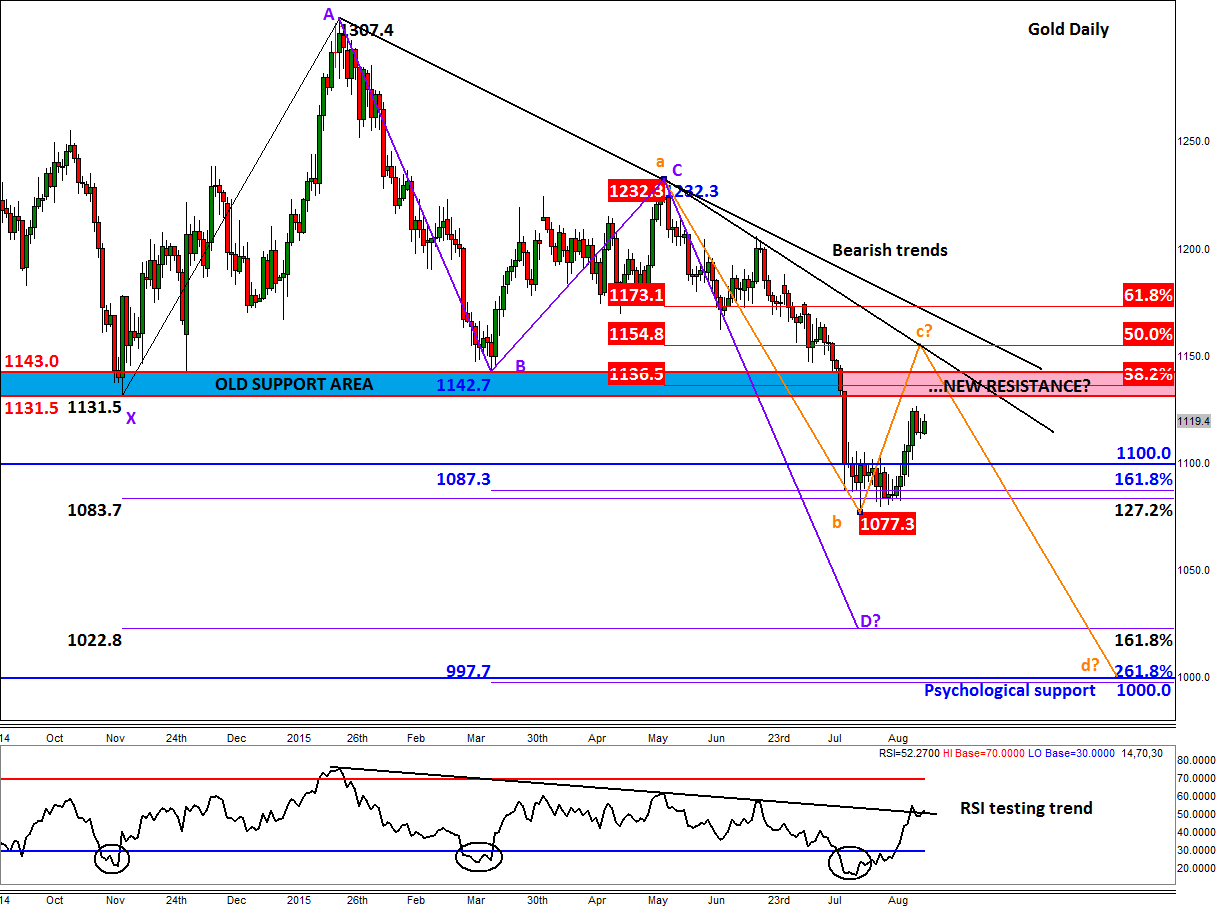
Last week gold managed to post its first gain in eight weeks. Prices were supported almost entirely by a slightly weaker US dollar and momentum buying after its technical breakout above a consolidative range between $1080 and $1100. Though the sudden devaluation of the yuan last week effectively increased the cost of gold for Chinese buyers, some of the impact of this was probably neutralised by additional buying to hedge against further declines in the value of the Chinese currency and stock markets. Thus the events from China last week is unlikely to have had a big net impact on physical demand for gold. Indeed, not much has changed materially for gold’s near-term bearish fundamental outlook, with global inflation remaining low and US stock prices still elevated. Thus the opportunity cost for holding gold – an asset which does not pay interest and costs money to store – is still relatively high. Until such a time that equity prices start rolling over and/or global inflation increases noticeably, it is unlikely that the physical demand for gold would rise materially. We are of the view that this latest bounce is merely a counter-trend move inside a larger bearish cycle which could therefore be an opportunity for some to sell gold at better levels with a favourable reward-to-risk profile.
Indeed, gold is heading towards some key resistance levels where the metal may resume its long-term bearish trend. First and foremost, a significant area of resistance is seen around $1131/2 to $1142/3. As shown on the chart, these levels were formerly support and so could turn into resistance upon re-test. What’s more, there are a couple of trend lines coming into play around these levels too. Depending on the speed of the potential rally, the first trend line may come in somewhere inside the abovementioned range while the other one could be further higher around $1155. Furthermore, the Fibonacci retracement levels of the most recent downswing are also now in sight: the 38.2% is at 1136/7; 50% at $1155 and 61.8% at $1173. So, lots of resistance levels to keep an eye on… and thus plenty of potential trading opportunities to look forward to.
From a trading point of view, conservative speculators may wish to hold off fire until the price of gold shows a clear signal that a top is formed around one of the above resistance levels. That’s because the bullish momentum appears to be gaining strength, as illustrated for example by a rallying Relative Strength Index (RSI). The RSI is currently testing its own resistance trend around 53. If it breaks through the trend line and holds above the key 60 level then the underlying price of gold may likewise go on to break its own bearish trends before moving aggressively to the upside. That being said, the RSI’s bounce looks impressive only because it has risen from a low base and following a lengthy two-week consolidation period. Thus, for gold to attract fresh buying interest it will have to break its own trend line regardless of what the RSI is indicating. All the same, the RSI’s bullish indications should not be ignored.
Meanwhile the key support level to watch is around $1100. If this level breaks down then the selling pressure could accelerate and a revisit of July’s low at $1077 could be highly likely. And if $1077 breaks then there are not much further support levels until $1022/3 (161.8% Fibonacci extension of the XA swing) and $998/$1000 (261.8% Fibonacci exhaustion of BC/psychological level). In short, gold’s volatility could increase dramatically in due course.
Figure 1: