Gold advances as USD pauses for breath ahead of FOMC GDP
Gold is up for a second consecutive day and is trading around a good $1173 per troy ounce at the time of this writing. The […]
Gold is up for a second consecutive day and is trading around a good $1173 per troy ounce at the time of this writing. The […]
Gold is up for a second consecutive day and is trading around a good $1173 per troy ounce at the time of this writing. The rallying dollar has paused for breath ahead of the FOMC policy statement tonight and the US GDP data on Thursday, while the upsurge in equity markets have also slowed down, at least for the time being anyway. And with government bond yields in Europe falling further into the negative territory, gold’s appeal as a real alternative to fiat currencies has risen on a relative basis. Gold may also have found some support on evidence of stronger than expected physical demand from China, as exports data from the Census and Statistics Department of the Hong Kong Government implied yesterday. According to the data, China imported 97.2 tons of gold on a net basis from Hong Kong in September, which was the highest volume since November 2014.
Though the Federal Reserve is widely expected to leave interest rates unchanged at the conclusion of the FOMC meeting later today, there is a risk that it will deliver a more dovish message following the recent soft patch in US data and the ECB’s unexpectedly dovish press conference last week as after all, the Fed will not want the US dollar to appreciate significantly more against the euro than it already has. This would signal to the market that the Fed may delay raising rates until at least the first quarter of 2016, leading to a sharp drop in the US dollar and a rally in buck-denominated assets like gold and silver. Alternatively, if the Fed either implicitly or explicitly maintains status quo i.e. that a 2015 lift is still on the cards at the December meeting then the dollar would likely remain supported. Perhaps more important than this particular FOMC meeting, will be Thursday’s release of the Advance US GDP estimate for the third quarter. If the actual growth in the third quarter deviates significantly from the expected 1.6% annualised increase then we may see a correspondingly sharp move in the dollar, and in turn gold.
Technical outlook
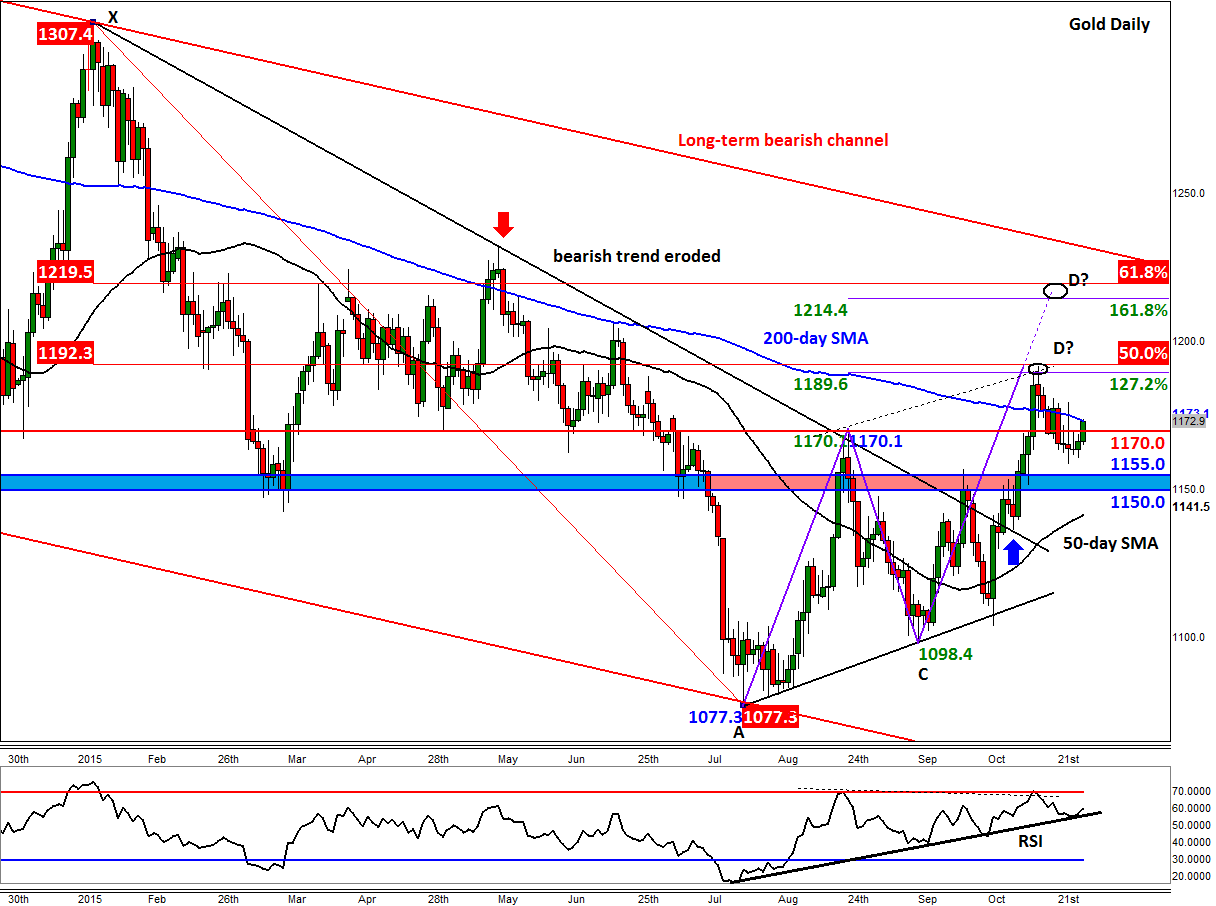
At the beginning of October, gold broke out of a consolidation pattern and took out the bearish trend line that had been in place since the start of the year. The precious metal then rallied for the next couple of weeks before finding strong resistance in mid-October around $1190, a level which marks the point D of an AB=CD move with the convergence of a couple of Fibonacci levels – in other words, a Bearish Gartley/Bat pattern. The resulting sell-off from there helped to push the metal below the old resistance level of $1170. Although the metal is now trading back above $1170 today, it will need to end the session above here in order to erode the short-term bearish bias. An even more bullish outcome would be if the metal also closes decisively above the 200-day moving average at $1173. If seen, a revisit of $1190 would become highly likely.
Beyond $1190, the next key area of resistance is around $1215/20 (circled on the chart). This is where the extended point D (1.272) of AB=CD converges with the 61.8% Fibonacci retracement of XA and 161.8% extension of BC price swings, which therefore means it is a more significant Bearish Gartley pattern. What’s more, gold still resides within a long-term bearish channel, the resistance trend of which comes in around the $1220/30 area. So, while the short-term technical outlook could turn bullish above a decisive break above the 200-day SMA, the slightly longer term focused bullish traders may still want to proceed with extra caution until such a time we potentially clear the rest of these technically-important levels.
Meanwhile another rejection at the 200-day SMA and a close below the $1170 level would further enhance the bearish argument. The bullish technical outlook would become invalidated upon a decisive break back below the $1150 handle. In this scenario, gold may then drop back towards its 50-day SMA, currently at $1140, before deciding on its next move.