Global stocks tumble as 2016 trading begins
It is a Happy New Year for the stock markets bears today. A sharp sell-off in Chinese stocks saw the Shanghai Composite drop almost 7 […]
It is a Happy New Year for the stock markets bears today. A sharp sell-off in Chinese stocks saw the Shanghai Composite drop almost 7 […]
It is a Happy New Year for the stock markets bears today. A sharp sell-off in Chinese stocks saw the Shanghai Composite drop almost 7 per cent overnight, triggering a trading halt there. The selling continued in Europe where the German DAX index was off about 4% at the time of this writing, causing US index futures to further widen their overnight losses. The risk off trade was trigged first and foremost by disappointing manufacturing data out of China overnight and increased geopolitical risks in the Middle East after Saudi Arabia executed a top Shia Muslim cleric which infuriated Iran. On top of this, traders who had positioned themselves for a Santa Rally in December were left disappointed after the global stock markets ended 2015 with a whimper. The withdrawal of bids from this group of market participants has undoubtedly added to the selling pressure. The S&P 500 ended the year almost flat but had it not been for the so-called “Fangs” (a group of stocks that include Facebook, Amazon, Netflix and Google, together rising about 60% on the year) things could have been a lot worse. Indeed, the majority of the S&P 500 companies fell in 2015, a year in which the Fed finally raised interest rates for the first time since 2006. Obviously the persistently weaker oil and the drop in other commodity prices were a big reason for stock market’s dire performance last year. But it wouldn’t take much for the “Fangs” to also start heading lower now.
However, interest rates are likely to remain historically low this year and this could help to support the markets as investors seek higher-yielding assets. But as far as today is concerned, is this steep sell-off justified? Undoubtedly, liquidity levels are low in this first trading day of the year and this sell-off could prove to be short-lived, especially since we have lots of important economic data coming up this week, including the Fed’s minutes and US monthly jobs report. The US fourth quarter earnings will unofficially start next week, too. Thus, sentiment could very easily turn positive. So, one should be wary of such a development amidst all this doom and gloom and this could be a mere “bear trap” sell-off.
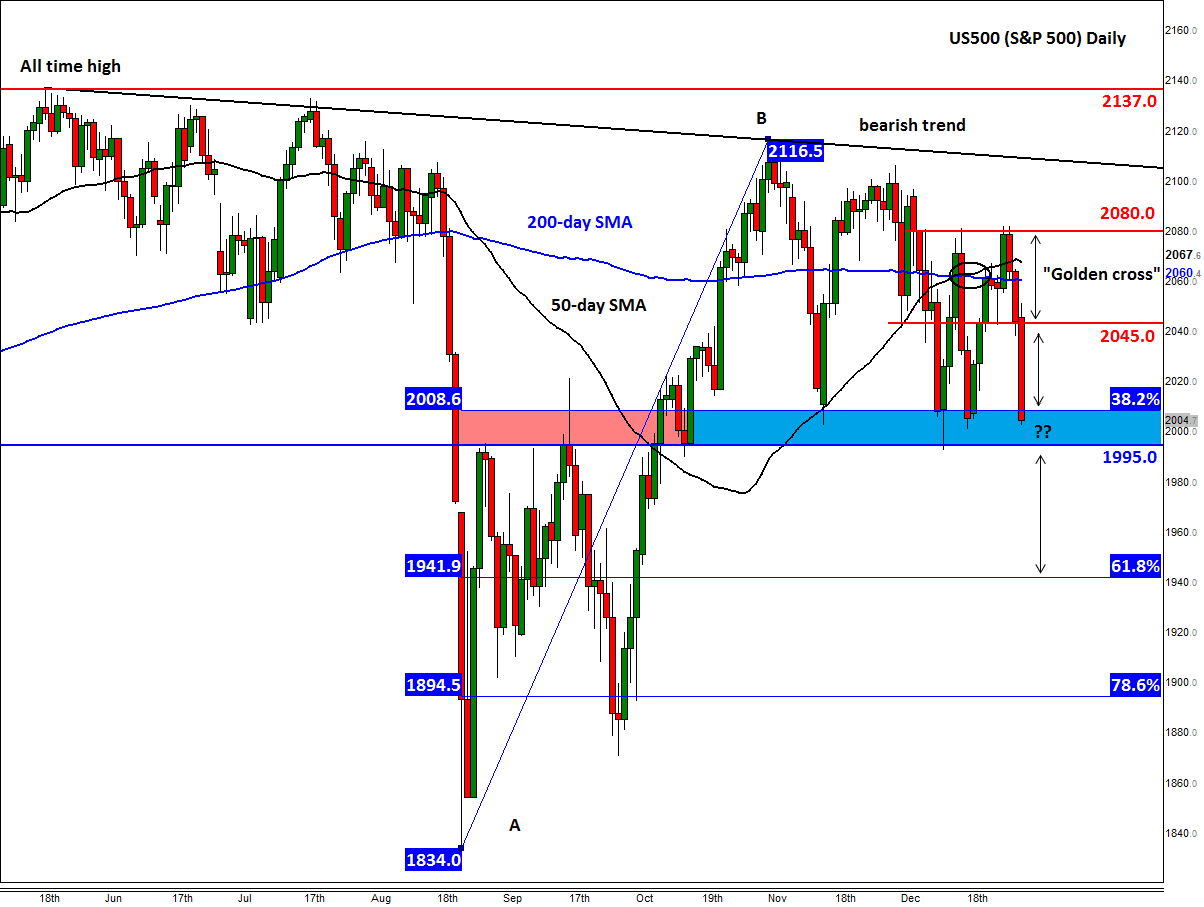
From a technical perspective, the S&P 500 is still in consolidation in spite of today’s selling. Neither the bulls nor the bears appear to have so far managed to push the index outside of its recent ranges between 1995 and 2080. A decisive break outside this range could therefore lead to a significant move in that direction. Since the index is currently near the lower end of the above-mentioned range, where it is also testing the shallow 38.2% Fibonacci retracement of the up move from the August low (at 2008), there is the possibility for a rebound here. The bears have already had at least three failed attempts at trying to break this key support range between 1995 and 2008 (shaded in light blue). Added to this, the 50-day moving average (2068) has already moved above the 200 MA (2060) again to create a so-called “golden crossover.” This is an important development for some momentum traders. This group of market participants typically only buy when an asset’s moving averages are in this order (of course, only when their other entry criteria are also met). The last time the S&P’s golden cross occurred was in early 2012, which saw the index climb steadily for the next few years until a “death cross” (i.e. 200 SMA < 50="" sma)="" was="" formed="" last="" august.="" although="" we="" always="" warn="" that="" historical="" data="" is="" not="" a="" good="" indicator="" of="" future="" performance,="" the="" markets="" do="" tend="" to="" move="" higher="" when="" a="" golden="" cross="" happens.="" in="" the="" case="" of="" the="" s&p,="" this="" crossover="" had="" occurred="" some="" 22="" times="" since="" 1970,="" according="" to="" dow="" jones.="" of="" those="" occurrences,="" the="" index="" traded="" higher="" 19="" times="" a="" year="" later.="" this="" would="" thus="" be="" the="" 23rd="" crossover="" since="" 1970.="" will="" we="" see="" higher="" stock="" prices="" in="">
But there are also plenty of reasons for this market to correct itself, including the much-talked about narrowing stock market breadth (number of falling stocks outpacing the risers). The year-long struggle of the S&P to move decisively higher from these levels clearly suggests the multi-year bull trend is fatigued. Thus, for the bulls to win control they will now need to chop some wood. The immediate resistance levels to watch are at 2045 and 2080, followed by a bearish trend line around 2100/10. The previous all-time peak was formed around 2137 in May. On the downside, a potential breakdown of the abovementioned key support area between 1995 and 2008 could lead to a sharp drop, potentially towards the 61.8% Fibonacci retracement level at 1942 and possibly beyond.