Glencore 8217 s latest comeback
Investors in two high-profile bellwethers of the ‘commodity super-cycle’ collapse put their misgivings aside on Wednesday, at least temporarily, sparking impressive rallies in both. Glencore, […]
Investors in two high-profile bellwethers of the ‘commodity super-cycle’ collapse put their misgivings aside on Wednesday, at least temporarily, sparking impressive rallies in both. Glencore, […]
Investors in two high-profile bellwethers of the ‘commodity super-cycle’ collapse put their misgivings aside on Wednesday, at least temporarily, sparking impressive rallies in both.
Glencore, perhaps the most infamous miner in the world, after the spectacular rout in its shares last autumn, saw its stock rise as much as 16%.
And shares of Anglo American snapped out of Tuesday’s schizoid volatility which at times swung deep into positive and negative territory in the wake of a surprise announcement that the group would dispose of iron ore assets after posting a $5.6bn net loss.
Anglo stock advanced more than 17%.
Given that there’s been little Glencore disclosure of late, it might be the most interesting of the pair to examine more closely.
In the absence of major announcements, the trigger appeared to be news that the Anglo-Swiss commodity producer and trader raised its available credit by $8.4bn as part of a refinancing of short-term debt.
Glencore’s net debt was recently still about $30bn according to Reuters News on Wednesday.
However data retrieved from Thomson Reuters Eikon suggested Glencore’s net debt stood at $48bn at the end of the last 12 months, though the disparity might have been due to out-of-date filings.
Either way, the fact that the group—which lost 80% of its market value between July 2014 and September 2015—was able to secure continued credit was a market confidence booster.
We’re not inclined to see the news or the stock move as anything more than that.
GLEN’s biggest risks remain its exposure to a severe commodity price recession which shows little genuine sign of coming to an end, and its humongous leverage.
The group’s commitments, assuming $30bn is correct, would still swamp its forecast underlying earnings (EBITDA) 3.5 times if called-in simultaneously.
Whichever figures one chooses to believe, the fact remains Glencore has yet to make significant progress in reducing debt from the levels seen last year, when GLEN embarked on a programme of disposals, restructuring, capex cuts, etc.
Still, Glencore said in December it had increased current liquidity to more than $14bn.
That meant it no longer needed a facility of the same size as last year.
At best then, Wednesday’s news represented incremental progress, which is naturally better than backsliding.
No doubt strong optimism around global markets on Wednesday over prospects of an OPEC-led oil production freeze, added a bit of turbo to all commodity-linked shares.
That helped explain double-digit percentage rises by Glencore late in the session.
From a technical perspective, Glencore shares were well on the way to redeeming themselves—for the second time since the September tumble.
Recall that the stock rose more than 100% from all-time lows around 66.7p on 28th September to 137p in October, before plunging anew.
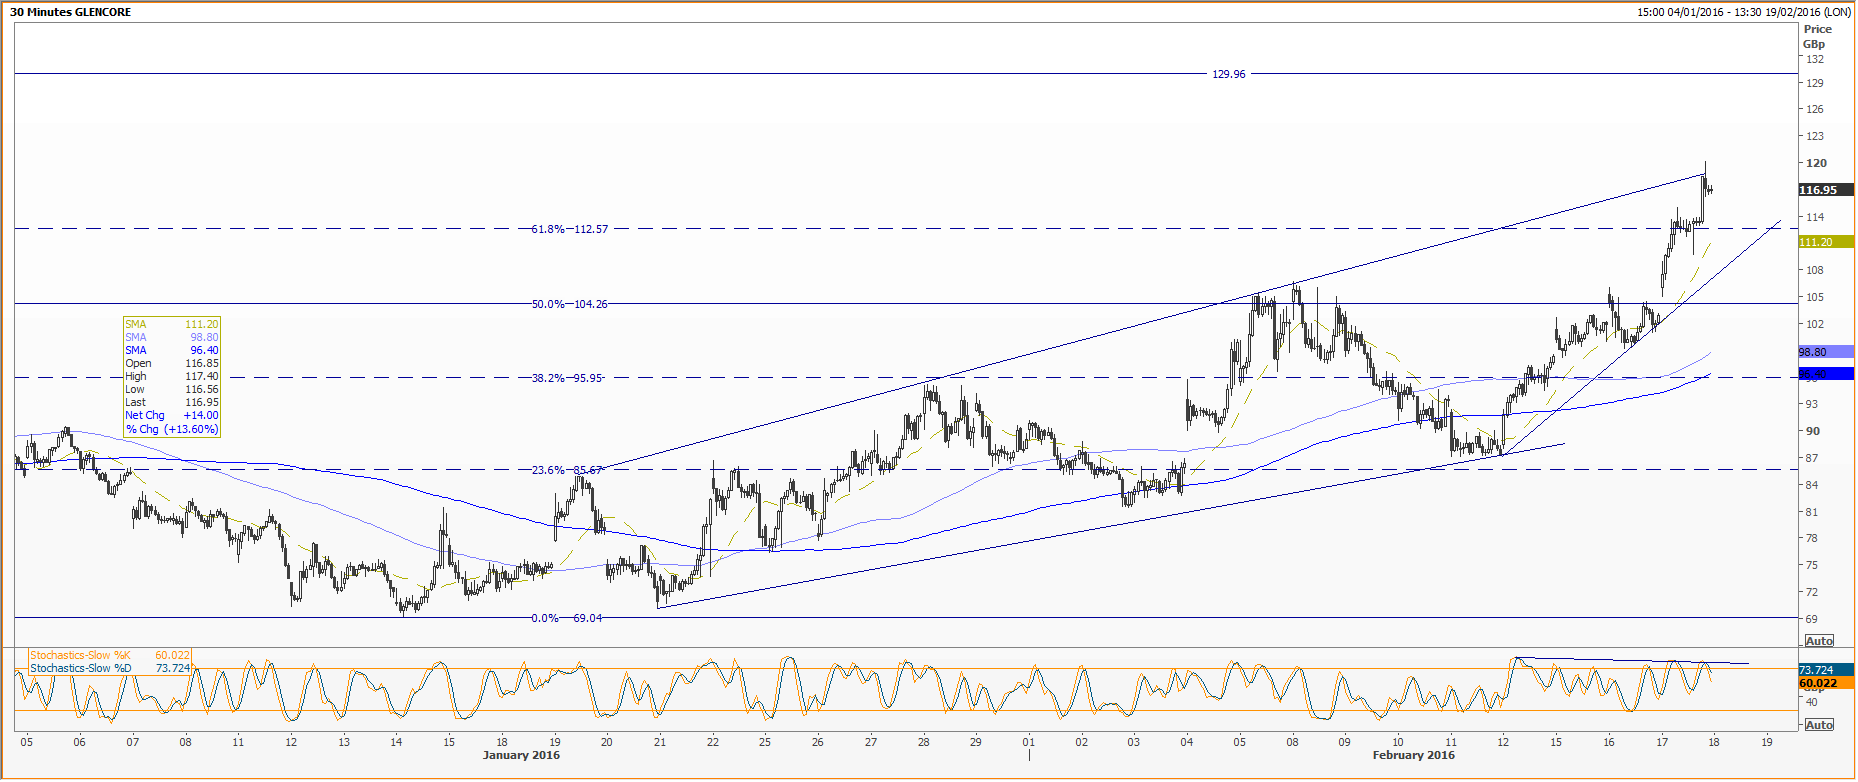
GLEN recently recouped 61.8% (112.57p) of the loss during the relapse, surpassing that Fibonacci interval which traders tend to regard as one of the most important.
In the half-hourly chart, the stock is in a robust phase: above 21, 50 and 100-period moving averages (red-dotted, lilac and blue lines respectively).
To progress further, the price would first need to surmount a rising trend overhead that has suppressed GLEN since late January.
After that, crystal-clear resistance at 129p from early November, the commencement of the stock’s retreat after a strong recovery in October, would be in view.
Should GLEN succeed in besting 129p, another look at that post-crisis rally high (137p) would be feasible.
Near-term softening would probably pause first at the 61.8% (112.57p) level mentioned above.
If broken, slippage to a rising line which sets up a triangulation—a potential precursor to a break-out—could be on the cards.
Given that this short-term up-leg is already technically overstretched (Slow Stochastic sub-chart, orange and purple lines) failure around current levels might bring a fair chance of a fall back below £1, perhaps as low as 87p.
HALF-HOURLY CHART
Please click image to enlarge
