


August 4, 2021 12:04 PM
German Bund Yields fall below -0.50; Highly correlated with EUR/JPY in short-term
There has been a lot of talk lately about the drop in US 10-year yields, moving from 1.7742 on March 30th, down to today’s lows near 1.1320. However, this move has not even reached a 50% retracement from the March 2020 lows to the recent highs, which is at 1.0566.
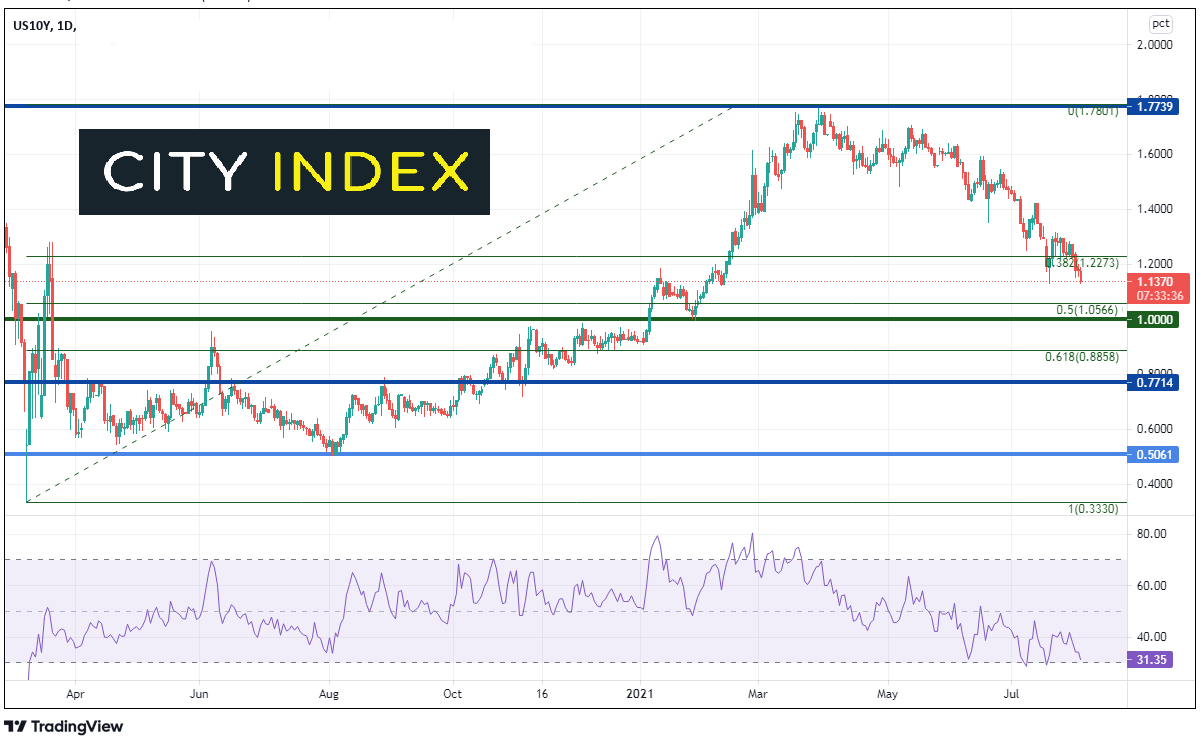
Source: Tradingview, Stone X
Compare this to the move in the German 10-year Bund yields. Price reached a recent high of -0.0771 on May 19th, and today broke aggressively through the 50% retracement level from the March 2020 lows to the May 19th highs, at -0.4926, as well as the psychological round number support level of -0.5000. Bund yields traded at their lowest level today since February 2nd. As why shouldn’t they be? The ECB has said nothing to indicate that they will taper soon, indicating that they will ignore transitory inflation and continue to purchase bonds at a higher pace than earlier in the year. The next support level isn’t until -0.5660, so Bund yields still may have some room to go before pausing. Below there is the 61.8% Fibonacci retracement level from the previously mentioned timeframe at -0.5906. However, notice though that the RSI is in oversold territory, indicating the possibility of a short-term bounce. Resistance is at today’s highs near -0.4770. (As of the time this article was published, Bunds have moved higher and if they close near -0.4770 will have formed a nice hammer doji, indicative of a reversal).
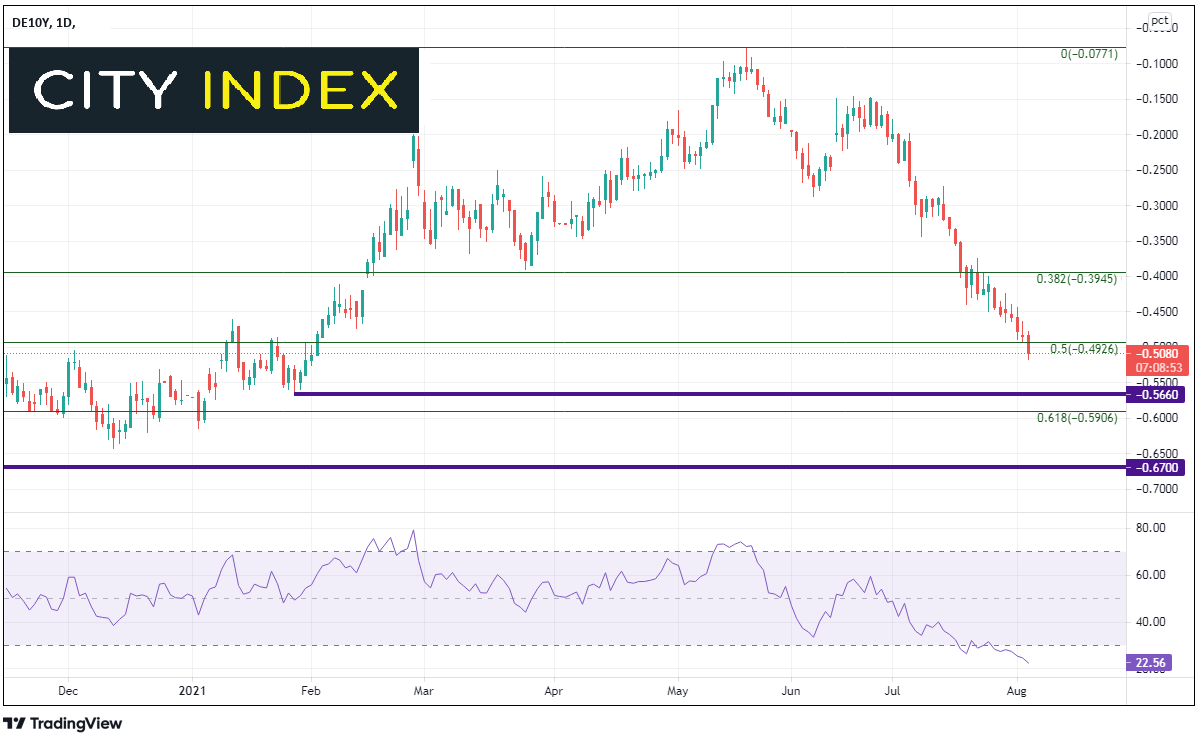
Source: Tradingview, Stone X
What is Forex Currency Correlation?
As opposed to the daily correlation between US 10-year yields and USD/JPY, which has a correlation coefficient of +0.82, the correlation coefficient between German Bunds and EUR/JPY on the daily timeframe is only +0.50. However, on a shorter timeframe, the two assets are very much correlated since the beginning of this week. The current correlation coefficient between German Bund Yields and EUR/JPY on a 240-minute timeframe is +0.94!
After reaching a near-term high on June 1st at 134.11, EUR/JPY has been pulling back in an orderly channel. The pair reached a low within the channel at 128.81, testing the bottom trendline of the channel before bouncing. Resistance is currently at the top, downward sloping trendline near 130.25 and then the July 29th highs of 130.56. If price does breakout of the channel, the next resistance level is 131.29. Support is back at today’s lows of 129.13, then horizontal support at 128.20. The bottom trendline of the channel now crosses near 127.50, which is also horizontal support.
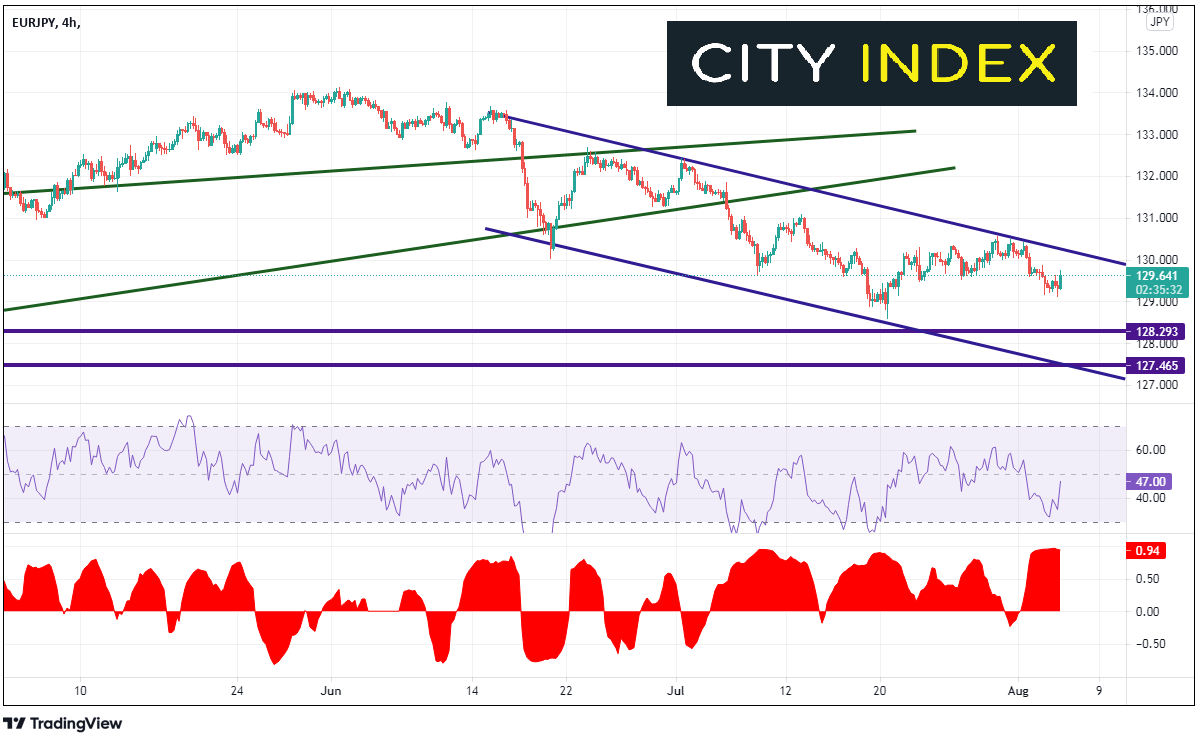
Source: Tradingview, Stone X
German Bund Yields and EUR/JPY have not been highly correlated in the long-term. However, in the shorter-term, the 2 assets are very highly correlated. For now, if you are looking for direction in EUR/JPY, considering looking at Bund yields for help!
Learn more about forex trading opportunities.
Latest market news
Yesterday 03:00 PM
Yesterday 01:12 PM
Yesterday 11:14 AM
Latest Forex articles
April 24, 2024 03:14 PM
April 24, 2024 11:00 AM
April 23, 2024 11:09 PM