GBP USD trading near four year highs
GBP/USD (daily chart shown below) is currently trading just off its four-year high of 1.6840 that was established late last week. From the beginning of […]
GBP/USD (daily chart shown below) is currently trading just off its four-year high of 1.6840 that was established late last week. From the beginning of […]
GBP/USD (daily chart shown below) is currently trading just off its four-year high of 1.6840 that was established late last week.
From the beginning of the current bullish trend in July of 2013 around the 1.4800 double-bottom low, the currency pair has risen by over 13% in only nine months.
Throughout the course of this strong bullish trend, the pair has made only relatively minor dips, displaying a remarkably sharp upward trajectory. This trajectory is highlighted by the fact that price action has consistently traded and recovered well above both its rising 200-day and 50-day moving averages.
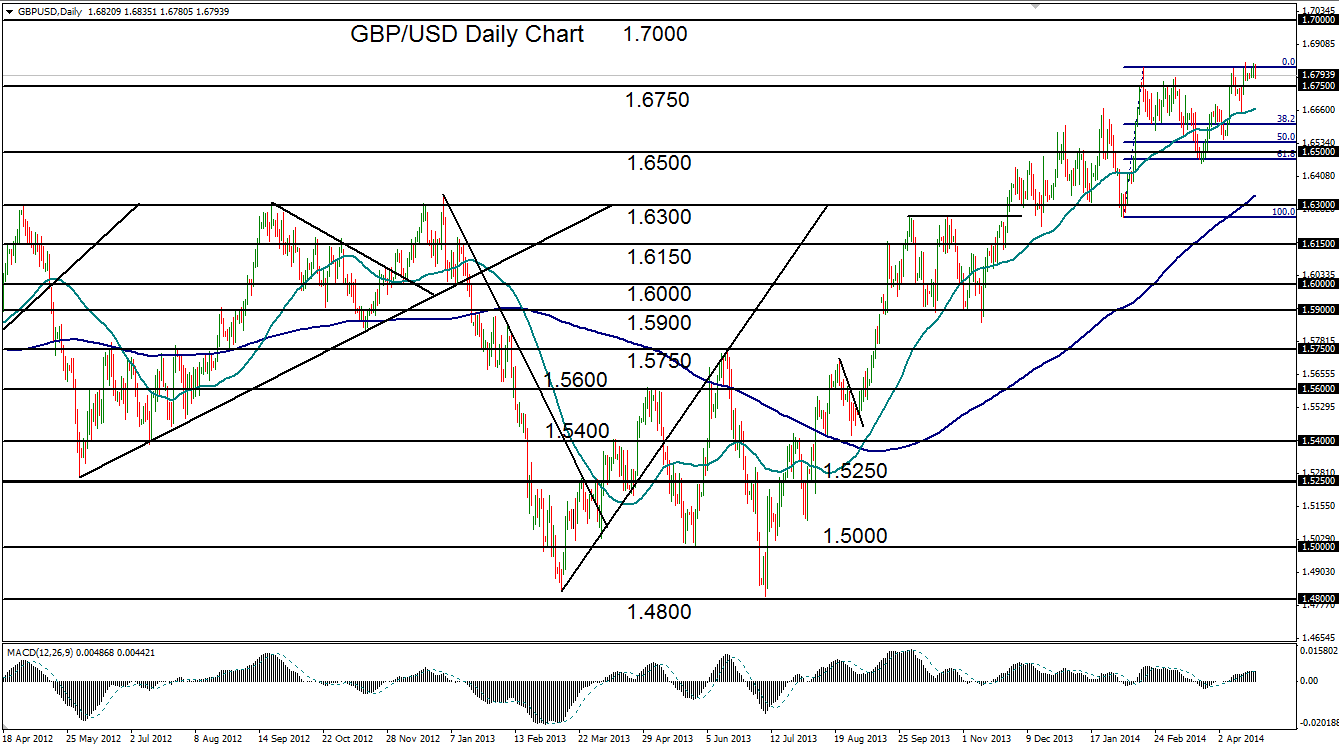
Currently consolidating very close to last week’s long-term high, which exceeded February’s 1.6821 high by around 20 points, GBP/USD is on track to continue its bullish trend after another potential pullback.
Short-term support on this potential pullback resides around the 1.6650 level, where it pulled back to the 50-day moving average early last week.
To the upside, a continuation of the sharp uptrend should look next to target the 1.7000 level, last reached in August of 2009.
