GBP USD surges toward six month high
GBP/USD (daily chart shown below) has continued its exceptionally sharp advance of the past two weeks to approach a six-month high for the currency pair. […]
GBP/USD (daily chart shown below) has continued its exceptionally sharp advance of the past two weeks to approach a six-month high for the currency pair. […]
GBP/USD (daily chart shown below) has continued its exceptionally sharp advance of the past two weeks to approach a six-month high for the currency pair.
The current rising trend began a month ago in mid-April, when GBP/USD rose from a new multi-year low of 1.4565. After advancing sharply from there, the currency pair retreated from key 1.5500 resistance in late April and early May.
The UK elections last week then prompted a further resurgence for sterling. This, coupled with a renewed weakness in the US dollar, has driven the recent GBP/USD recovery.
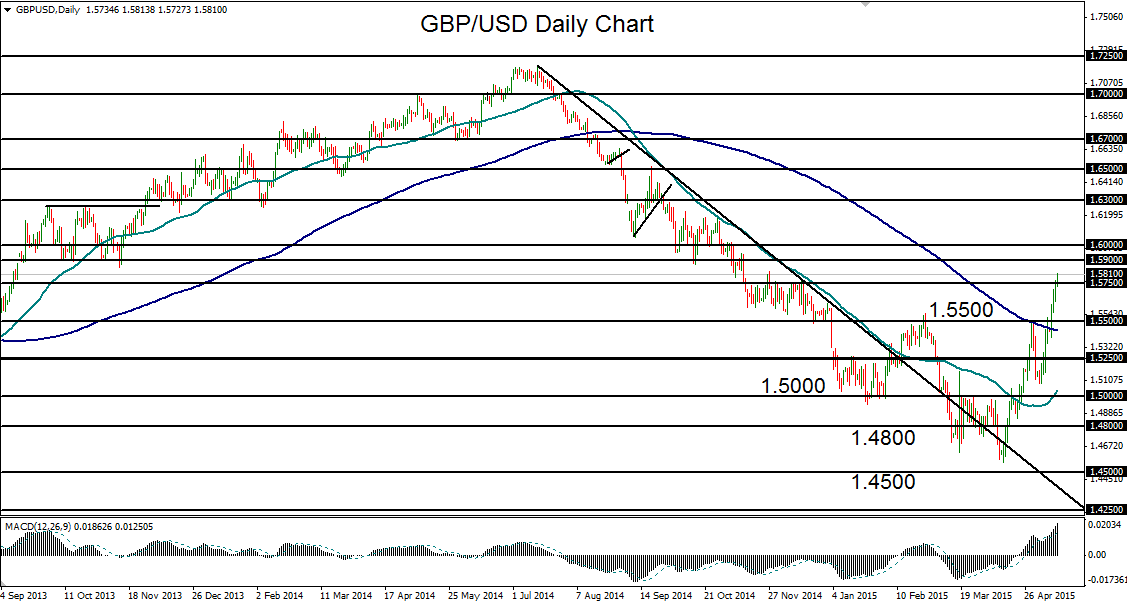
Having long risen well above both its 50-day and 200-day moving averages, as well as the noted 1.5500 resistance level, the currency pair has now tentatively advanced above further resistance at 1.5750.
Any continued surge for GBP/USD should meet major resistance around the 1.5900 and 1.6000 resistance levels. At or before the 1.6000 level may be reached, a pullback should be due after the recent sharp run-up. In the event of this pullback, the key downside target remains around the noted 1.5500 support/resistance level.
