GBP USD surges to approach multi year highs
GBP/USD (daily chart) surged rapidly on Thursday, with some initial continued momentum on Friday, to hit a high closely approaching early May’s four-year high of […]
GBP/USD (daily chart) surged rapidly on Thursday, with some initial continued momentum on Friday, to hit a high closely approaching early May’s four-year high of […]
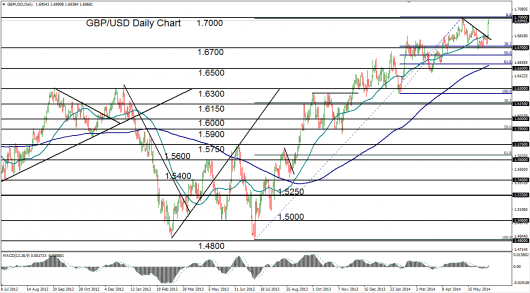
GBP/USD (daily chart) surged rapidly on Thursday, with some initial continued momentum on Friday, to hit a high closely approaching early May’s four-year high of 1.6995. This quick spike broke out above a short-term descending trend line that represented a month-long measured pullback from that multi-year high. The pullback had established strong support around the 1.6700-area lows before climbing and finally breaking out above both the noted descending resistance line as well as the key 50-day moving average.
As noted in our earlier analysis this week on GBP/USD, the pound has maintained exceptional strength against the US dollar for the past year, in contrast to other major currencies. This is exhibited in the steep bullish trend that has been interrupted only by relatively shallow pullbacks since the 1.4800-area low in July of 2013.
Having once again approached its upside resistance target at 1.7000, the currency pair could soon be poised for a breakout to new multi-year highs. In this event, GBP/USD could potentially climb further to target the 1.7250 resistance level. In the event that the pair turns back down from the current 1.7000 resistance area instead of breaking out, major support on another pullback continues to reside around the 1.6700 level.
