GBP USD slides further towards 1 4500
GBP/USD (daily chart shown below) has continued to hit new multi-year lows as its sharp plunge from late February pressures the currency pair towards its […]
GBP/USD (daily chart shown below) has continued to hit new multi-year lows as its sharp plunge from late February pressures the currency pair towards its […]
GBP/USD (daily chart shown below) has continued to hit new multi-year lows as its sharp plunge from late February pressures the currency pair towards its 1.4500 support target.
Prior to this plunge, a substantial February rebound lifted the currency pair from its late January long-term low of 1.4950, which was slightly under the key 1.5000 support level, up to the late February high of 1.5551.
Since that high, GBP/USD has plummeted below successively lower price targets, including 1.5250, 1.5000, and most recently, the key 1.4800 support level.
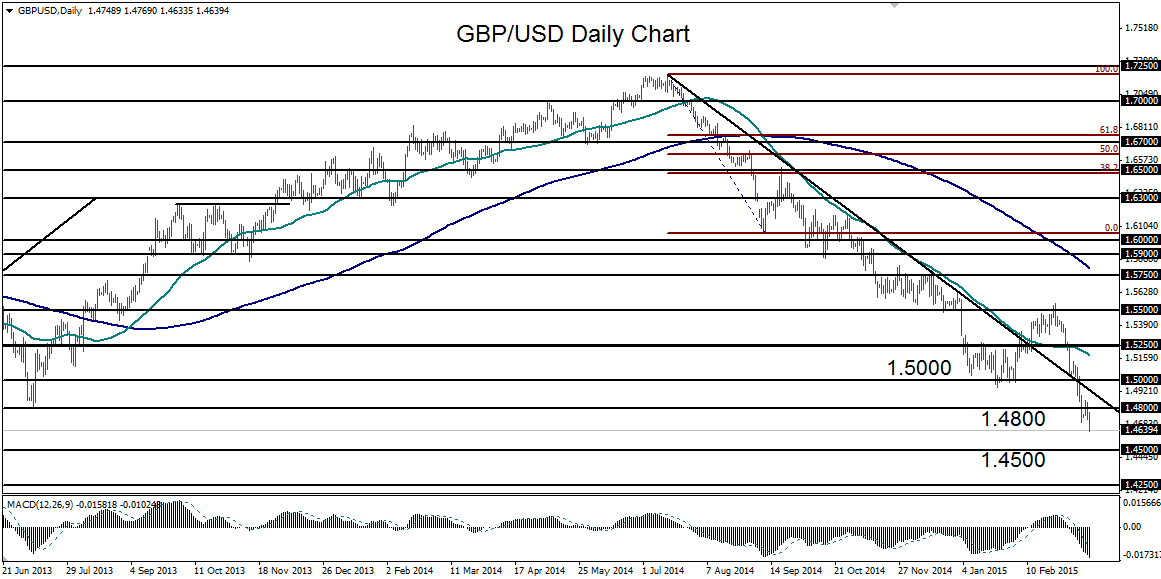
Wednesday’s price action saw yet another decline that brings the currency pair closer to its next major downside target around the 1.4500 support level.
The overall trend and technical indications for GBP/USD remain firmly bearish within the context of the entrenched downtrend that has been in place for the past eight months, since the July 2014 high of 1.7190.
Below the noted 1.4500 target lies a further downside objective at the major 1.4250 support level, which was last hit in mid-2010.
