GBP USD retreats sharply from resistance
GBP/USD (daily chart shown below) has retreated sharply within the past two days from major resistance around the key 1.5500 level. That 1.5500-area resistance is […]
GBP/USD (daily chart shown below) has retreated sharply within the past two days from major resistance around the key 1.5500 level. That 1.5500-area resistance is […]
GBP/USD (daily chart shown below) has retreated sharply within the past two days from major resistance around the key 1.5500 level. That 1.5500-area resistance is also around where the pivotal 200-day moving average is currently situated.
The current retreat occurs after two weeks of sharp advances that boosted the currency pair from its latest multi-year low of 1.4565 in mid-April all the way up to a two-month high near the noted 1.5500 resistance on Wednesday. That high fell just short of February’s high, which was slightly above 1.5500.
Prior to the sharp rebound and partial recovery from multi-year lows in the latter half of April, GBP/USD had been entrenched in a long and sustained bearish trend from its high of 1.7190 all the way back in July of last year.
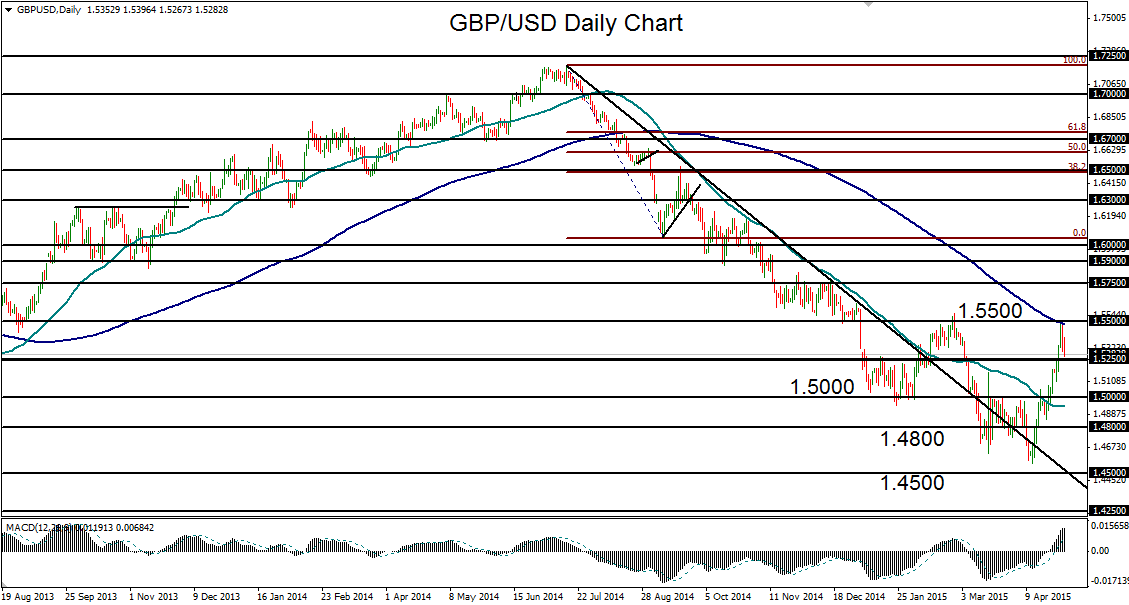
Currently, having retreated from both 1.5500 resistance and the key 200-day moving average, the currency pair has reached back down to the 1.5250 support/resistance level.
Any further retreat that breaks down significantly below the 1.5250 level could reinstate the overall bearish trend and pressure GBP/USD back down once again towards its 1.5000 psychological support level, followed by the 1.4800 downside target.
