GBP USD resumes retreat from highs
GBP/USD (daily chart shown below) has tentatively resumed its pullback from June’s highs after having been stuck trading within a tight consolidation range for the […]
GBP/USD (daily chart shown below) has tentatively resumed its pullback from June’s highs after having been stuck trading within a tight consolidation range for the […]
GBP/USD (daily chart shown below) has tentatively resumed its pullback from June’s highs after having been stuck trading within a tight consolidation range for the past week.
Prior to the current retreat, the currency pair rose to a year-to-date high of 1.5928 shortly after mid-June. Overall, this high represented a significant 50% bullish retracement of the previous downtrend that spanned from the five-year high of 1.7190 in July of last year down to the four-year low of 1.4565 this past April.
June’s run-up that resulted in that year-to-date high just above 1.5900-area resistance had over-extended the currency pair, placing it squarely in overbought territory. The resulting pullback quickly broke down below the key 1.5800 level as well as June’s short-term rising trend line.
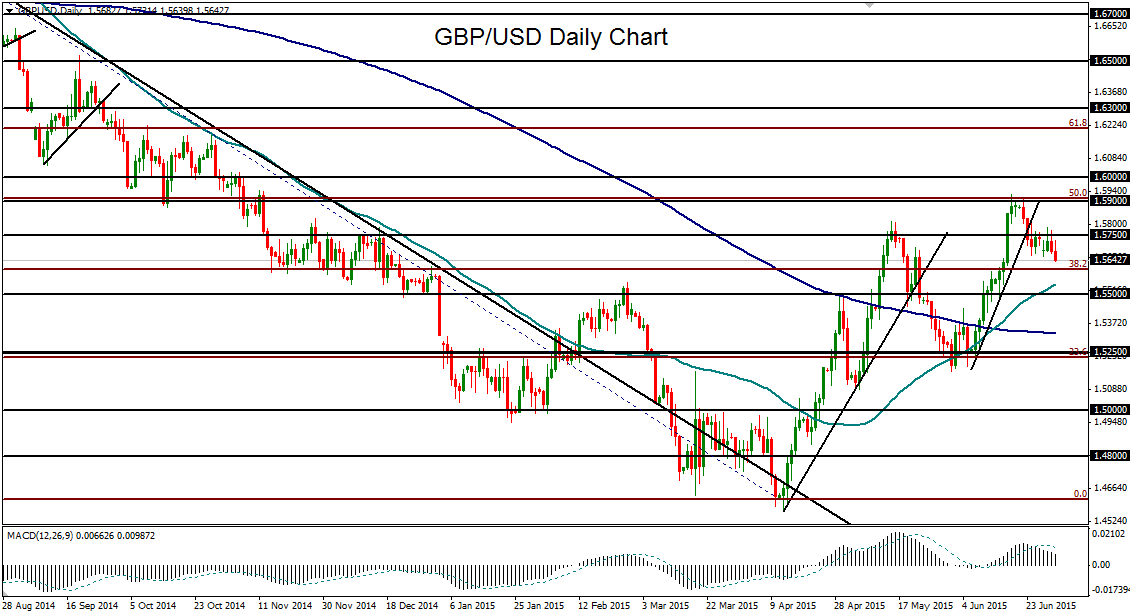
During the course of June’s rise, the 50-day moving average crossed above the 200-day average for the first time since the beginning of a bullish trend in late 2013. Despite this bullish technical indication, however, the current pullback could well have further to run to the downside on any sustained dollar strength.
If the currency pair continues to trade under the noted 1.5800 resistance level, the key downside target on an extended pullback resides around 1.5500, with a further downside pullback target around the major 1.5250 support area.
